Climate Scenario Analysis: Use Cases for Financial Institutions
Many governments and private-sector firms have committed to achieving Net Zero greenhouse gas (GHG) emissions, with the goal of limiting global warming to 1.5°C. Reaching Net Zero implies a decline in absolute GHG emissions at an unprecedented pace and a shift away from fossil-fuel reliant means of production, and sometimes fossil-fuel reliant business models, to low- or carbon-free alternatives.
The financial industry may play a role in this transition by “making finance flows consistent with a pathway towards low greenhouse gas emissions and climate-resilient development,” as stated by Article 2 of the 2015 Paris Agreement.
Climate scenario analysis can support the redirection of capital and re-alignment of portfolios with science-based emissions-reduction pathways. Financial Institutions (FI) can use such pathways to explore a range of possible futures and the implications for their strategies, plans, and investments.
This post aims to provide a framework to assess different emissions-reduction pathways and to explore five leading Net Zero pathways. The post also examines barriers to wider adoption of climate scenario analysis. In particular, differing sectoral and geographic granularities constrain the application of climate scenario analysis to the companies that are FI counterparties. ISS ESG has developed, as part of its Climate Solutions tools, guiding principles to address these adoption barriers and will continue to support FI in their climate scenario analysis exercises.
Selection of Leading Public Pathways
The public pathways discussed here were selected for their widespread use by FI and their publicly available data and documentation. Sources include the International Energy Agency (IEA) World Energy Outlook (WEO) 2022, the Phase III of the Network for Greening the Financial System (NGFS), and the One Earth Climate Model (OECM). In Figure 1, the IEA, OECM, and NGFS pathways are positioned according to their relative climate-related transition risks and physical risks, although physical risks are not explicitly modelled in IEA and OECM.
Figure 1: Selected Pathways
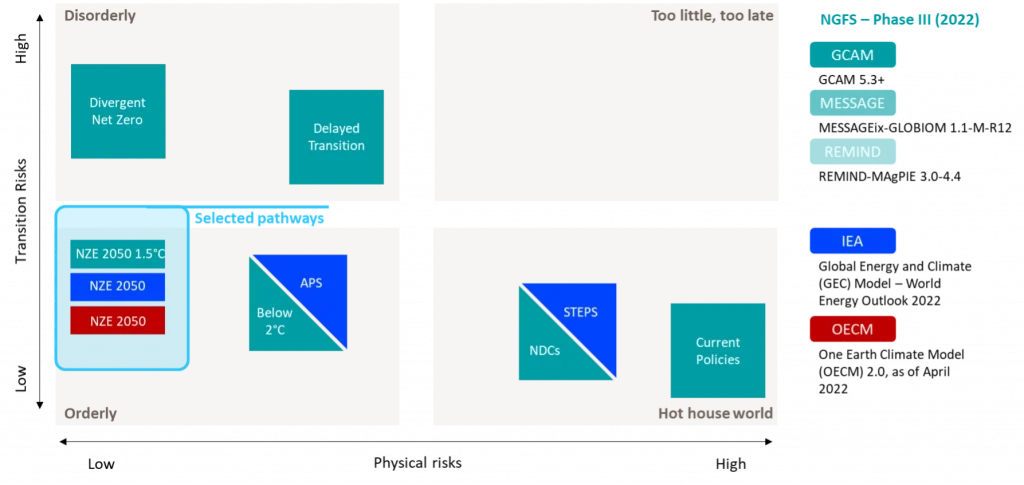
Notes: NZE = Net Zero Emissions, APS = Announced Pledges Scenario, STEPS = Stated Policies Scenario, NDCs = Nationally Determined Contributions. Red = OECM; blue = IEA; green = NGFS.
Source: ISS ESG Research, adapted from NGFS for illustrative purposes only.
There are, in total, 22 pathways based on five different “Integrated Assessment Models” (IAMs), including six NGFS pathways run on three IAMs (GCAM 5.3+, MESSAGEix-GLOBIOM 1.1-M-R12, and REMIND-MAgPIE 3.0-4.4). IEA and NGFS pathways can be used to assess the impact of various levels of transition and physical risks, which are linked to the stringency and coordination of climate action.
Limiting the most adverse effects of physical climate change impacts by achieving Net Zero emissions is a common goal for actors of the Race to Zero coalition, which includes several FI. There is, nevertheless, no single pathway to reach such a goal.
The following sections examine the orderly Net Zero pathways developed by the IEA, NGFS, and OECM and analyse them according to their total carbon budgets, socio-economic and technological development assumptions, and sectoral and geographic granularities.
Pathway Ambition: Total Carbon Budget
In its latest Assessment Report, the IPCC (Intergovernmental Panel on Climate Change) restated that there is a near-linear relationship between cumulative human-induced CO2 emissions and the increase in global surface temperature. Figure 2 shows the remaining carbon budgets—that is, the amount of carbon that society can emit before overshooting a given temperature limit—under both IPCC estimates and the pathways identified above.
Figure 2 – Total Cumulative 2020-2050 Net CO2 Emissions (from Energy Combustion, Industrial Processes, and AFOLU) under Different Pathways
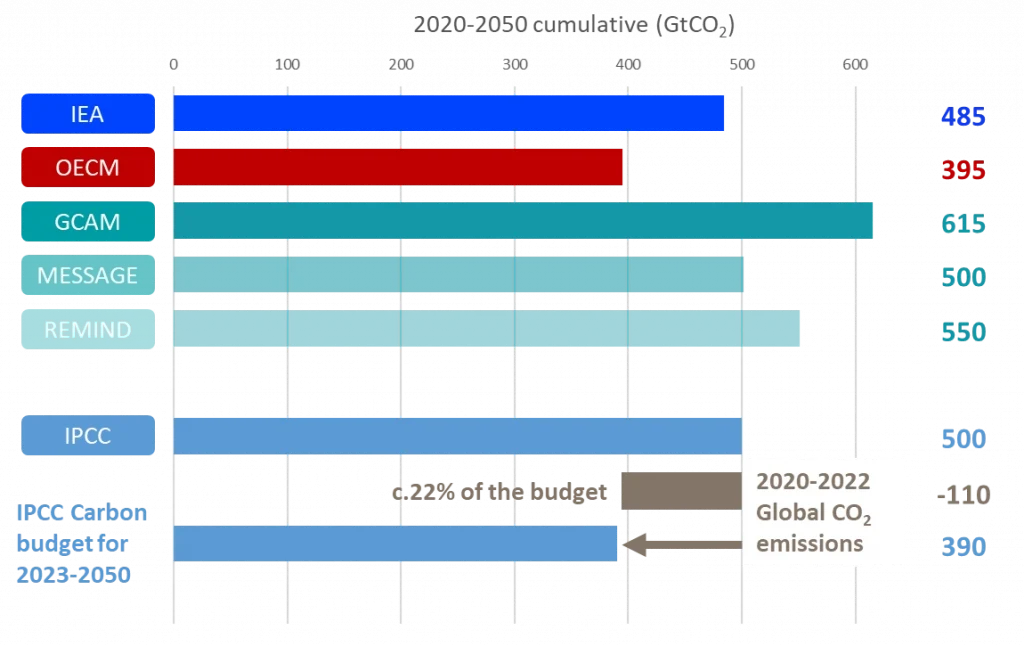
Note: AFOLU = agriculture, forestry, and other land use. Measures to address AFOLU emissions are not explicitly part of the IEA NZE Scenario, thus only cumulative 2020-2050 net CO2 emissions from energy combustion and industrial processes are displayed for IEA.
Source: ISS ESG Research, based on IEA WEO22, OECM 2.0, NGFS Phase III, IPCC AR6
Climate science is inherently uncertain, which means that carbon budgets are estimated based on a given probability: The higher the probability of staying below a temperature threshold is, the smaller the carbon budget. OECM is the most stringent pathway, projecting a temperature rise limited to 1.5°C with a 67% probability, while the carbon budgets for other pathways are given for a 50% probability and hence have larger budgets.
The remaining 1.5°C carbon budgets for the selected pathways differ because of the timing of Net Zero emissions, as shown in Figure 3, and the reliance on carbon dioxide removals, as shown in Figure 5.
Figure 3 – Total Net CO2 Emissions of Selected Orderly Net Zero Pathways for the Period 2020-2100 (from Energy Combustion, Industrial Processes, and AFOLU)
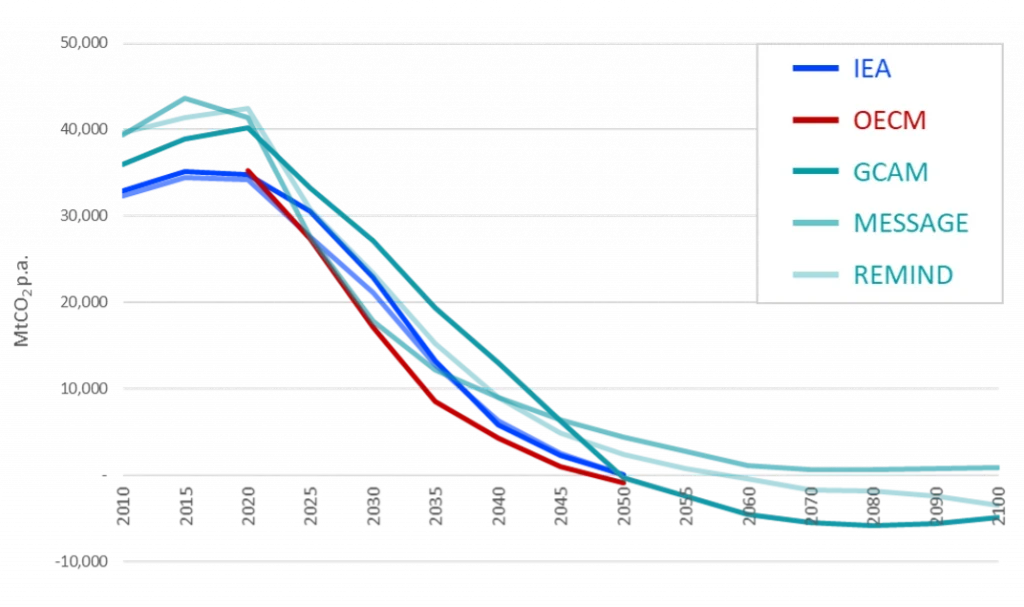
Source: ISS ESG Research, based on IEA WEO22, OECM 2.0, NGFS Phase III
Figure 3 also highlights that historical data (2010-2020) is not consistent across pathways, indicating differences in baseline estimations methods and coverage and creating further comparison challenges.
Using up-to-date pathway data or adjusting for the current level of emissions is critical for scenario analysis to be of any use for FI. From 2020 to 2022, the world has consumed almost a quarter of a 30-year budget that aligns with 1.5°C with a 50% likelihood, as outlined by the IPCC (AR6 Summary for Policymakers, Table SPM.2).
Socio-economic Assumptions
Even though the selected pathways rely on five major IAMs, only two Shared Socioeconomic Pathways (SSPs) are explored. SSPs are narratives which include projections for economic and population growth, which are key drivers of energy demand and therefore shape model outputs for GHG emissions at a sectoral and a regional level. For instance, SSP2: Middle of the Road is the narrative that “the world follows a path in which social, economic, and technological trends do not shift markedly from historical patterns.”
Figure 4 – Positions of Selected Pathways Relative to the SSPs
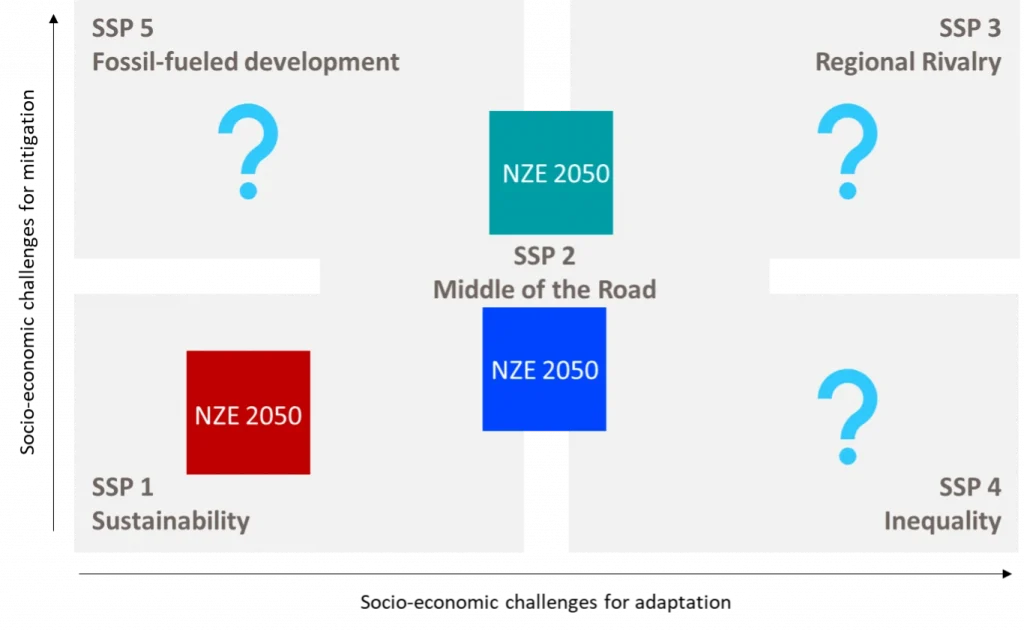
Source: ISS ESG Research, adapted from SSPs, for illustrative purposes only
Figure 4 shows that several SSPs, such as SSPs 3, 4, and 5, are left unexplored, representing a major drawback for scenario analysis. Their absence can potentially hide from FI a full set of possible futures and their associated financial impacts and risks. For instance, transition and physical risks’ financial impacts may be unevenly distributed in a pathway that is more aligned with SSP3: Regional Rivalry, in which “policies shift over time to become increasingly oriented toward national and regional security issues.” Such limitations have been highlighted by the NGFS in its 2023 Survey on Climate Scenarios and FAQ.
Technological Development Assumptions
Figure 5 shows that there is relative consensus across the different pathways on two fundamental elements of the energy transition: the rapid phase-down of fossil fuel usage, and the expansion of renewable energy. The pathways require coal power plants to be phased out by mid-century, with advanced economies leading the way. IEA and OECM Net Zero Pathways explicitly do not allow for new oil, gas, and coal project development from 2021.
Figure 5 – Comparison of Pathways for Carbon Dioxide Removal (CDR) and Energy among Pathways
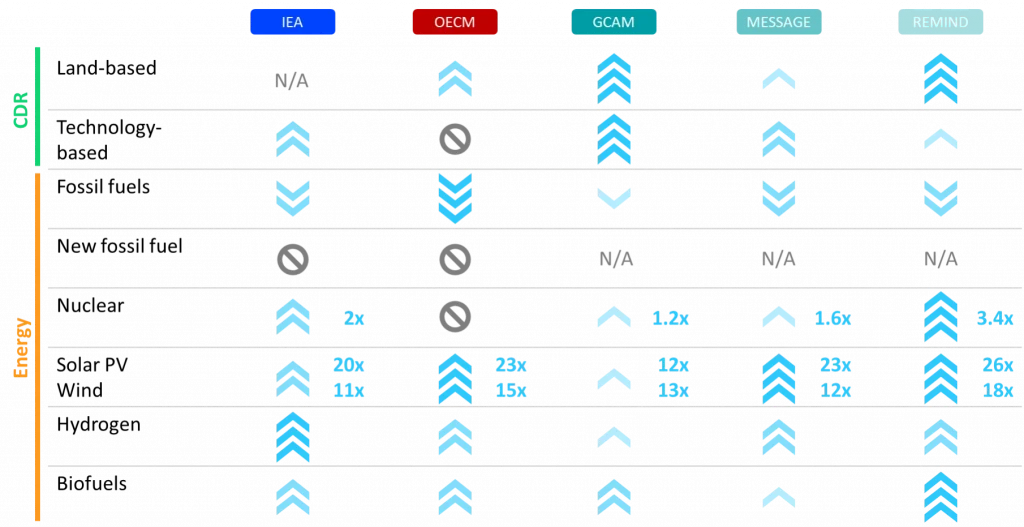
Note: An “Up” arrow indicates that the technology is being developed, while a “Down” arrow means the technology is being phased down. The number of arrows and shading indicate the speed and extent of the development / phase down. Multipliers represent the installed capacity increase between 2020 and 2050.
Source: ISS ESG Research, based on IEA WEO22, OECM 2.0, NGFS Phase III
However, Figure 5 also shows that some other technologies (e.g., nuclear and CDR) are deployed to different extents among pathways. Pathways are developed by different working groups, for which conscious or unconscious value judgements may lead to different assumptions about technology availability and costs. IEA GEC is a granular energy model and thus does not rely on land-based sequestration but relies extensively on the technology-based Carbon Capture and Storage (CCS) to offset residual emissions. CCS is excluded in OECM, being seen as not market ready, while the NGFS pathways use both solutions to varying extents.
The underlying pathway assumptions may provide a useful guide for FI to shape their lending, investment, and insurance activities, and related services, in line with their expectations of what a Net Zero transition in specific sectors may entail.
Barriers to Adoption
Several key barriers stand in the way of the wider adoption of climate scenario analysis. For example, climate scenario analysis remains an emerging discipline for many FI, one which requires new skills, data, and methodologies, as well as time to build infrastructure.
Another barrier is that clear, complete, and open access to underlying data, models, and documentation is often lacking. Further, the scope and formatting of the pathways lack standardization, which makes direct comparison difficult. FI also lack guidance to integrate scenarios into their strategic, operational, and reporting activities, without compromising the science.
Two other barriers, differing levels of sectoral and geographic granularity, are examined in more detail below.
Sectoral Granularity
FI have exposure to diverse sectors, which differ in their current emissions profiles and decarbonization potential. For instance, some sectors are considered hard to abate due to high abatement costs and/or the lack of low-carbon technology availability or substitutes. Differentiating pathways for a variety of sub-sectors may be useful for FI.
Pathways provide different levels of sectoral granularity, ranging from around 10 to 20 distinct sub-sectors, as depicted in Figure 6. FI may need to use assumptions to harmonize and increase the granularity of the pathways to get insightful and actionable outputs from the analysis. This may include disaggregating emissions pathways from residential and commercial buildings and distinguishing the different transport sub-sectors. In practice, FI may need to rely on mappings with established sector classifications (e.g., NACE) to consolidate with data available for their counterparties.
Figure 6 – Highest Sectoral Granularity per Model
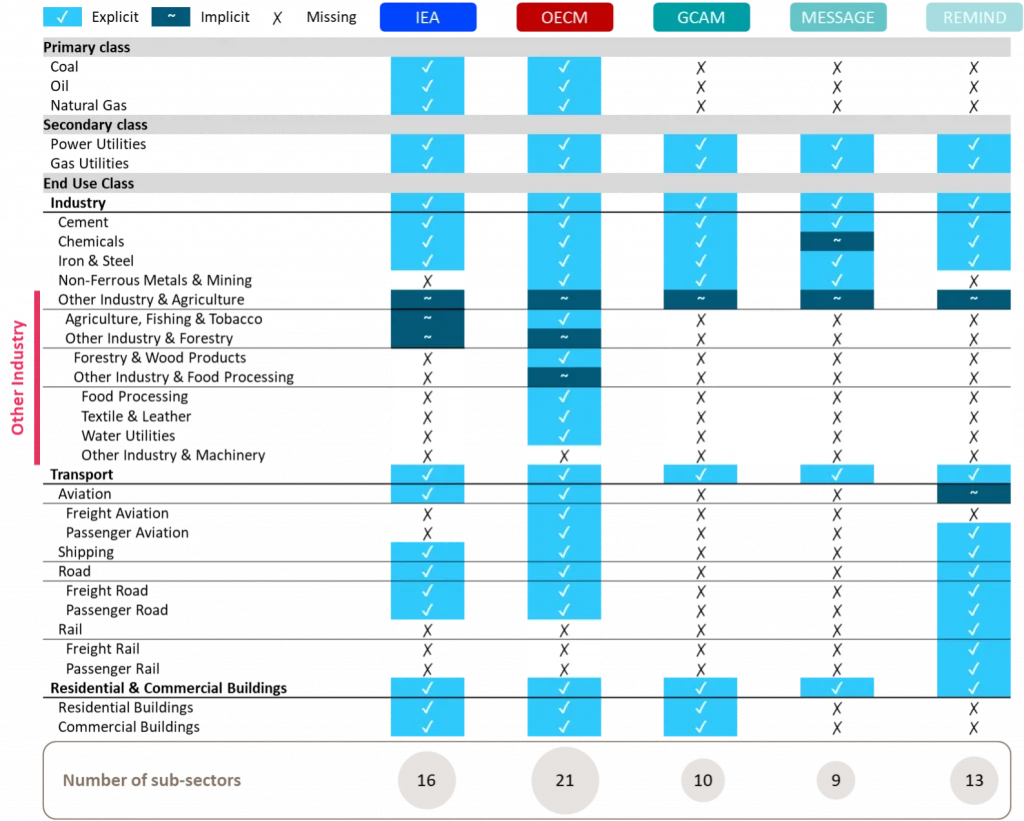
Source: ISS ESG Research
Geographic Granularity
FI have different geographical footprints, and pathways may try to provide differentiated regional outputs. Paris Agreement signatories adhere to the principle of “common but differentiated responsibilities and respective capabilities, in the light of different national circumstances (Article 2.2.)” defining the types and timing of actions. Financing needs and opportunities are therefore not uniform. Generally, developed markets are expected to lead the way in decarbonisation investments and are expected to reach Net Zero emissions earlier than developing economies.
Pathways have varying levels of geographic granularity, ranging from world level outputs to around 180 country variables. For a given provider, the geographic granularity of data may also differ. Figure 7 shows that IEA NZE is less granular than APS and STEPS.
Figure 7 – IEA WEO 2022 and OECM Geographic Granularities
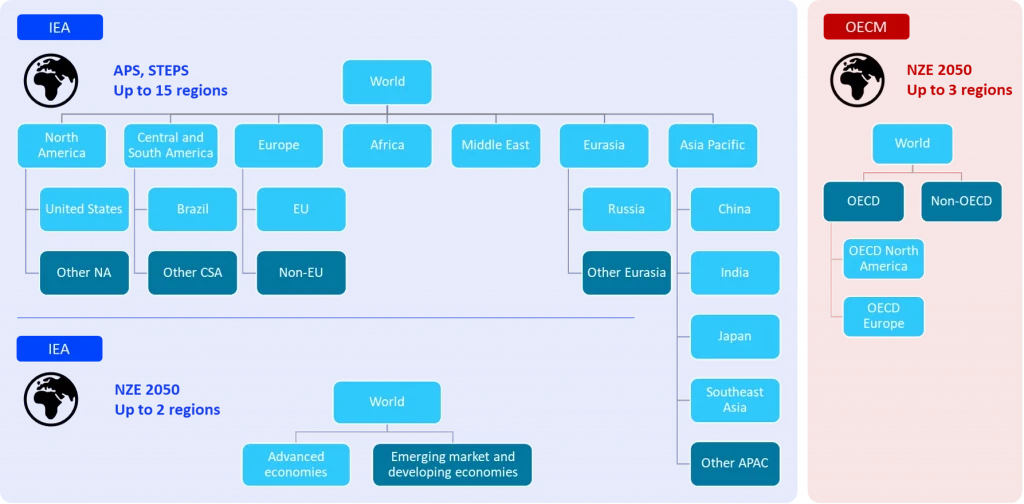
Source: ISS ESG Research, based on IEA WEO22, OECM 2.0
FI may need to use assumptions to harmonize and increase the granularity of the pathways to get insightful and actionable outputs from the analysis.
Conclusion and Next Steps
How can consistent scenario analysis be conducted given the barriers identified above? The systematic review of pathways assumptions and what it means for FI is a required but preliminary step. Particular attention shall be brought to the pathways’ carbon budgets and socio-economic and technological development assumptions.
ISS ESG has developed, as an update to its Climate Solutions tools, guiding principles (Figure 8) to address adoption barriers with integrity and transparency. The aim is to support FI in conducting effective scenario analysis and/or to support the interpretation of public pathways from a range of different providers. The principles can assist FI to make informed decisions that align with their investment beliefs.
Figure 8 – Guiding Principles
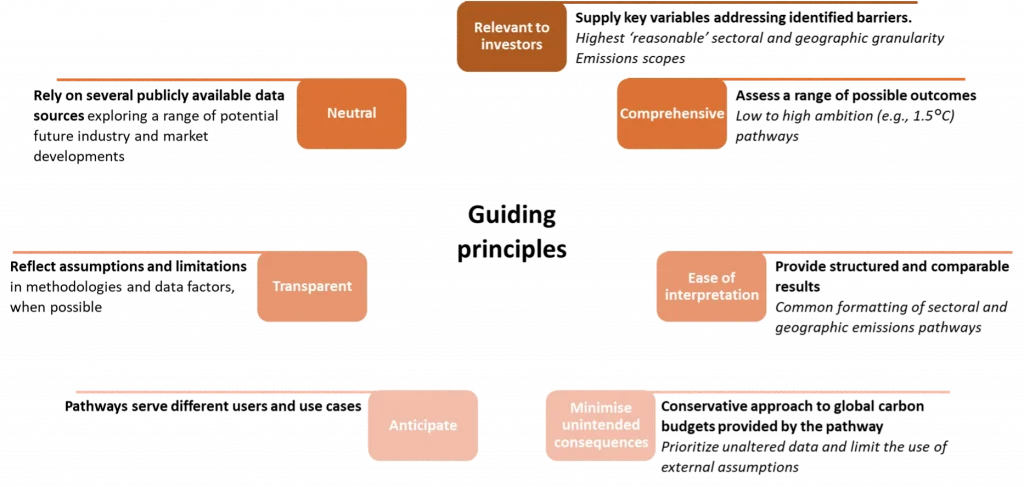
Source: ISS ESG
The guiding principles could be applied to identify business-relevant variables derived or expanded from public sources. Climate scenario analysis is an iterative process, which can be refined as models and methodologies evolve and converge.
Explore ISS ESG solutions mentioned in this report:
- Use ISS ESG Climate Solutions to help you gain a better understanding of your exposure to climate-related risks and use the insights to safeguard your investment portfolios.
By: Benoît Billard, Climate Transition Risks Specialist, ISS ESG