
The sustainable debt market has grown significantly in the past decade and continues to expand, with the total amount of issuances exceeding USD5 trillion. In particular, green bonds keep gaining significant traction, as highlighted in the first article of this series, “The Sustainability Bond Rating and the Current GSSS Market.” The outstanding value of green bonds has increased by 14% from 2023 to 2024, according to a Sustainable Bond Market database available from the International Capital Market Association (ICMA).
ISS’ Sustainability Bond Rating (SBR) solution was launched in April 2025, with the objective of assessing the sustainability performance of Green, Social, Sustainable, Sustainability-Linked (GSSS) bonds. In this context, sustainability performance refers to a bond’s potential to generate positive environmental and/or social impacts. (The methodological foundations and assessment criteria of the SBR solution have been detailed in the second part of this series, “An Innovative Solution for Financial Markets: ISS ESG’s Sustainability Bond Rating.”)
GSSS bonds (also referred to as labeled bonds) are broadly categorized into two types: “use of proceeds bonds (UoP)” and “sustainability-linked bonds (SLBs).” The SBR solution uses different, yet comparable, approaches to assess UoP and SLB bonds. Such assessments enable investors to compare impact within and across labeled bond categories through a unified framework and assessment scale (Figure 1).
Figure 1: Overall Weights for Sustainability Bond Rating
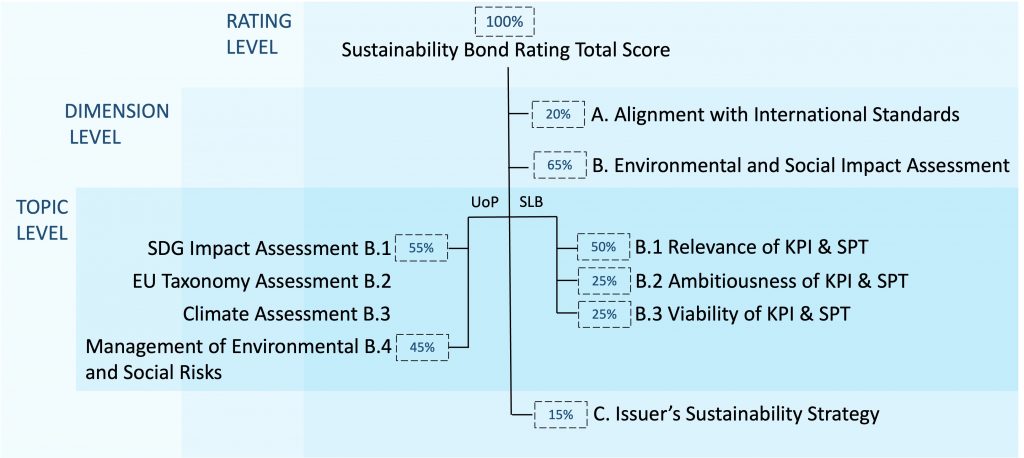
Note: UoP = Use of Proceeds Bonds; SLB = Sustainability-Linked Bonds; KPI = Key Performance Indicator; SPT = Sustainability Performance Target.
Source: ISS Sustainability Solutions
This article in the series will focus on the early trends observed from the assessment of approximately 1,400 UoP bonds. The analysis includes an overview of the coverage of bond labels, currencies, and geographies. Also, the analysis will provide insights into the distribution of rating scores, allocation to project categories as mapped per the ICMA Principles, data points on refinancing, potential impact on the UN Sustainable Development Goals (SDG), and EU Taxonomy (EUT) disclosures.
The article’s aim is to identify patterns emerging in the assessed universe to explore how sustainability considerations are integrated into the labeled bond market at this stage.
Analysis of the most common project categories financed across labeled bonds that dominate the investment landscape, such as renewable energy and green building projects, provides several key insights. For example, analysis of proceed allocations to projects with potential environmental or social benefits make it possible to identify broad contributions to relevant UN Sustainable Development Goals. Also, data on lookback period disclosures for project refinancing can help identify potential greenwashing risk related to labeled bonds.
Coverage
The SBR solution covers labeled securities issued by global corporate and sovereign issuers, as well as government agencies. This article’s analysis is based on a sample of approximately 1,400 bonds exclusively constituted of UoP instruments. Of these UoPs, green bonds dominate the sample, followed by social and sustainability bonds, as illustrated in Figure 2.
Figure 2: Coverage of SBR Solution Sample per Use of Proceeds Bond Type
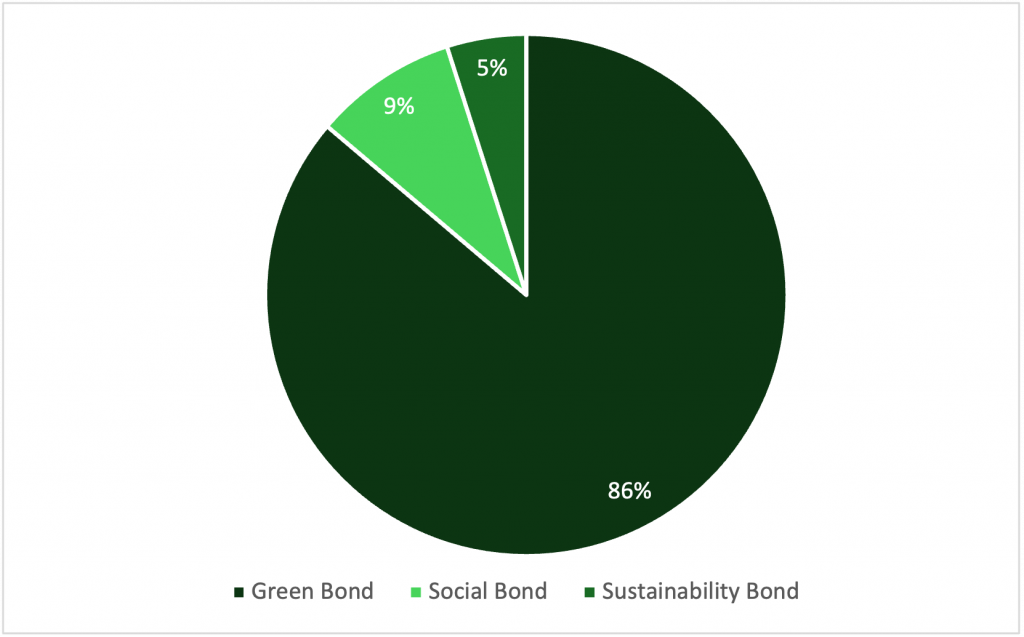
Note: This figure reflects a sample of approximately 1,400 bonds
Source: ISS Sustainability Solutions Sustainability Bond Rating
The majority of green bonds in the sample also reflect the labeled debt universe, in which green bonds make up approximately 60% of the total issued debt.
The SBR coverage already expands across the globe, with the highest number of issuers coming from Europe (63%), followed by issuers in North America (25%) and then Asia (9.2%). Overall, the sample presents data for 188 corporate, 14 sovereign, and 6 supranational issuers.
Roughly 43 bonds are issued in the United States, followed by 24 bonds and 23 bonds issued in France and Germany, respectively (Figure 3).
Figure 3: Issuance of Use of Proceeds Bonds, by Country
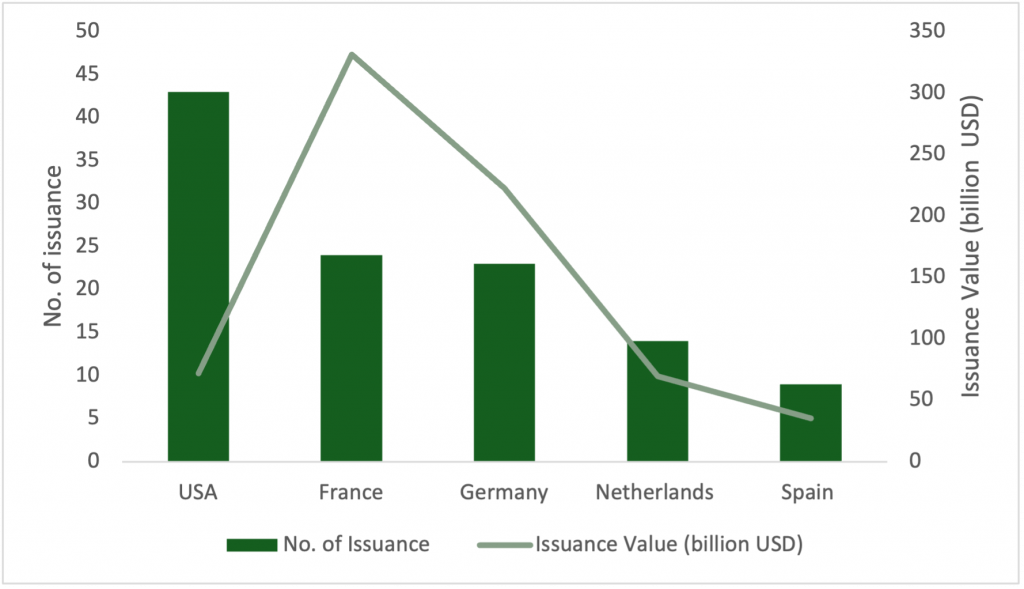
Note: This figure presents the top 5 countries, measured by number of issuances, within the covered sample of approximately 1,400 bonds. While issuance-related information is collected in native currency, the figure uses data in US dollars as of May 9, 2025, for a comparative analysis of countries with the highest number of issuances of Use of Proceeds bonds.
Source: ISS Sustainability Solutions
Measuring by the amount of issuance, bonds issued in France amount to USD331.5 billion and Germany to USD222.5 billion. However, bonds issued in the United States amount to only USD71.8 billion.
This data reflects the broad differences in the types of issuers and their issuance characteristics across the three countries, with Europe having a large share of sovereign/supranational issuers. In contrast, even though the number of bonds issued in the United States is much higher, these bonds’ issuance amounts are comparatively lower, likely due to numerous issuances of smaller denominations by corporate issuers.
Analysis
Building on observations regarding coverage, several key findings can be extrapolated from the SBR assessments. The following sections outline these findings in detail.
SBR Results
As mentioned in previous publications, SBR implements an established rating scale used across solutions such as the ESG Corporate Rating and the ESG Country Rating. This system uses both a numeric scale from 1 to 4, where 1 represents the lowest rating and 4 signifies the highest, and an alphabetic scale ranging from D- to A+ (Table 1).
Table 1: SBR Alphabetic and Numeric Rating Scale

Source: ISS Sustainability Solutions
This harmonized approach enhances comparability across different bond types, making it more straightforward for clients to integrate the rating system into their overall sustainability and investment strategies.
Measured by the overall rating score, the covered sample has yielded an average result of 2.502 on the numeric scale, corresponding to B- on the alphabetical scale. A detailed breakdown of current results can be found in Figure 4 below.
Figure 4: Overview of SBR Results – Covered Universe
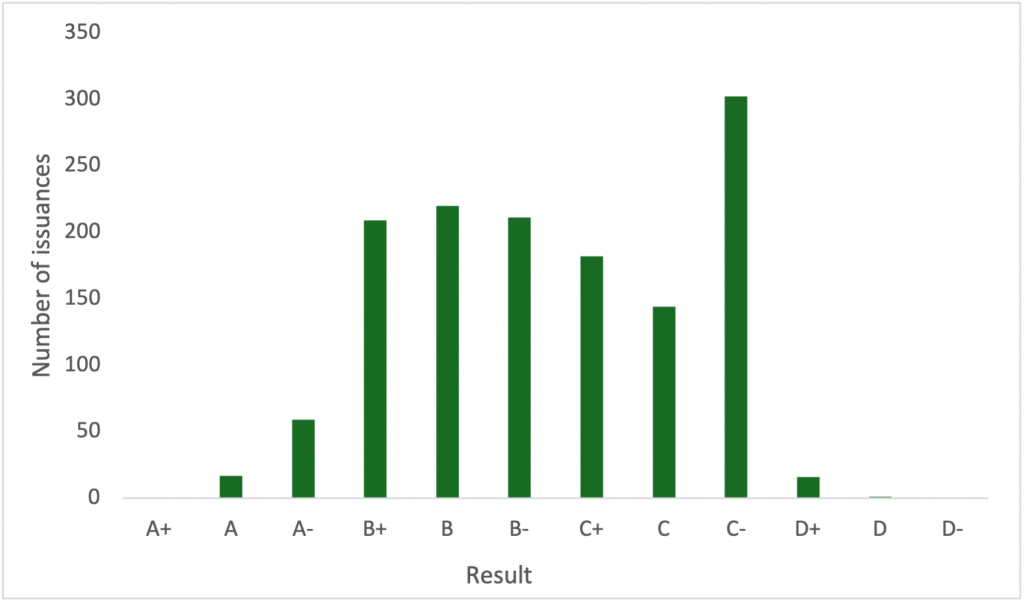
Note: This figure reflects a sample of approximately 1,400 bonds.
Source: ISS Sustainability Solutions
From the breakdown of the results in Figure 4, a few key takeaways become apparent. No issuances have received a score of D-, D, or A+ on the SBR alphabetic scale. Further, roughly 90% of issuances assessed score between a C- and a B+ on the alphabetic scale. The proportion of the alphabetic scores, as well as their classification, are as follows: D+, D, and D- (Poor) = 1.25%; C+, C, and C- (Medium) = 46.15%; B+, B, and B- (Good) = 47.02%; and A+, A, and A- (Excellent) = 5.58%.
This SBR data indicates that GSSS bonds, which are designed to raise debt to generate positive environmental and/or social impacts, have yielded relatively moderate results. The data also show that SBR methodology retains stringency through higher thresholds for excellent outcomes.
ICMA Category Allocation
SBR assesses bonds’ alignment with international standards and guidelines on labeled bonds, such as the ICMA Principles. ICMA’s Green Bond Principles and Social Bond Principles include high-level classification of projects with intended environmental and social benefits that bond proceeds can be allocated to.
Table 2 displays the 10 most common types of bond project categories (as defined in the ICMA Principles) in the covered sample.
Table 2: ICMA Bond Category Allocation

Note: This table reflects a sample of approximately 1,400 bonds. The same bond may sometimes include multiple project categories.
Source: ISS Sustainability Solutions
Table 2 shows that the list of 10-most-represented project categories is exclusively constituted of environmental-related projects. Among these, green-building-related categories are one of the most prevalent financed projects in the sample (“Buildings certified to a comprehensive sustainable building standard” and “Energy-efficient buildings”).
Additionally, renewable-energy-related categories are the most prominent in the sample, including categories related to energy generation based on renewable sources (e.g., solar and wind) or development of power plants. This relates to the current focus on, as well as the dominance of, green bond issuances in the market.
Project Refinancing
ICMA has also provided guidance and recommendations, through the Green Bond Principles and Social Bond Principles, on project refinancing. Both sets of principles explicitly state that refinancing of existing projects is allowed but that projects must still be considered eligible and meet other criteria, such as impact reporting and external reviews.
For additional transparency, SBR assesses issuance-level disclosure on the ability of funds from labeled bonds to refinance existing projects or projects under development. SBR also assesses disclosures on “lookback periods,” or how far back proceeds can be used to finance such projects (Table 3).
Table 3: Refinancing of Current Bond Universe

Note: This table reflects a sample of approximately 1,400 bonds
Source: ISS Sustainability Solutions
In Table 3, the data shows that for a small subset of the universe, refinancing is explicitly excluded and is deemed not applicable (1%). Further, the data shows that the majority of issuances in the current universe do not disclose limitations on refinancing (64%).
The high percentage of issuances that do not disclose refinancing conditions is significant, as the absence of such disclosure may be a facilitating condition for potential greenwashing.
Without disclosure, existing projects or assets can be classified as “sustainable” without commitments of fresh funds allocations. For instance, a hypothetical issuer that built a hydropower plant five years ago through a vanilla bond could use the proceeds of a newly issued green bond to refinance this construction. Lack of disclosure on lookback periods can lead to reduced transparency and exposes investors to greenwashing risk.
For issuances that do disclose their refinancing conditions, the majority of the issuances include a lookback period between 12 and 24 months (14%) and 24 and 36 months (17%).
SDG Impact Assessment
For UoP bonds, SBR’s environmental and social impact assessment can identify and quantify the potential link between funded projects and the UN SDGs, as well as evaluate the practices adopted by the issuer to address potentially negative externalities of the financed projects. This SBR assessment is based on the allocated share of each project category that contributes to or obstructs the achievement of one or more of the SDGs, either through business conduct or the issuers’ business practices.
In the bond sample, the largest shares of contributions correspond to SDG 7 (Affordable and Clean Energy), SDG 9 (Industry, Innovation and Infrastructure), SDG 11 (Sustainable Cities and Communities) and SDG 13 (Climate Action) (Figure 5).
Figure 5: Contribution of Green, Social, or Sustainability Bonds to SDGs
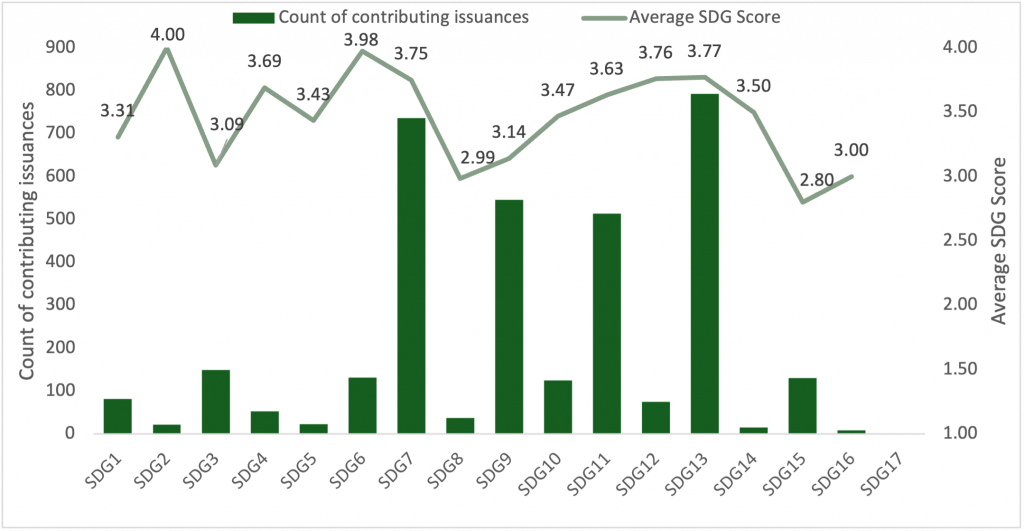
Note: This figure reflects a sample of approximately 1,400 bonds
Source: ISS Sustainability Solutions
This pattern of contribution shares is in line with the findings in the ICMA Category Allocation section above showing that categories related to renewable energy projects and green buildings are the most financed project categories within the sample. The pattern could also reflect the large proportion of green bonds within the universe.
The bond sample also shows large positive contributions to goals with social components, such as SDG 3 (Good Health and Wellbeing), SDG 6 (Clean Water and Sanitation), and SDG 10 (Reduced Inequalities). Some projects contributing to social components include healthcare provision or the operation of healthcare facilities and the financing of wastewater treatment plants or services enabling water savings, as well as the financing of educational facilities.
The lowest average score of 2.80 for SDG 15 (Life on Land) could be due to 40% of contributing bonds in the sample financing large-scale hydropower projects, which are assessed negatively because of their potentially negative impact on biodiversity. Nonetheless, this obstruction to SDG 15 is offset by contributions towards SDG 7 and 13.
Disclosure Related to the EU Taxonomy
Some issuers making disclosures under the EU Taxonomy regulation have chosen to rely on this framework to disclose potential eligibility or alignment of financed projects. These disclosures can merely be about the projects’ eligibility under the taxonomy or provide details on their substantial contribution and do no significant harm criteria, generating alignment.
For eligibility disclosures, bond documentation discloses that the projects being financed correspond to the eligible categories under the EU Taxonomy and therefore can be assessed for alignment with the taxonomy’s six environmental objectives. For alignment disclosures, bond documentation includes details on the projects’ aim to contribute to one or more of the six environmental objectives, do no significant harm to any of these objectives, and/or meet the minimum social safeguards as defined under the taxonomy. This information is collected by SBR to provide investors with additional context.
Of the sample of approximately 1,400 bonds, 882 are from issuers in Europe, meaning that they could potentially be subject to the EU Taxonomy Regulation. Out of the European bonds, 258 disclose funds allocated to EU Taxonomy-eligible or -aligned activities.
The subset of 258 bonds where detailed EU Taxonomy disclosures are provided is listed in Figure 6. Disclosure levels vary within this subset. The majority of issuances in the subset disclose allocation to EU Taxonomy-aligned activities but not the proportion of allocated proceeds.
Figure 6: Disclosures on EU Taxonomy Alignment
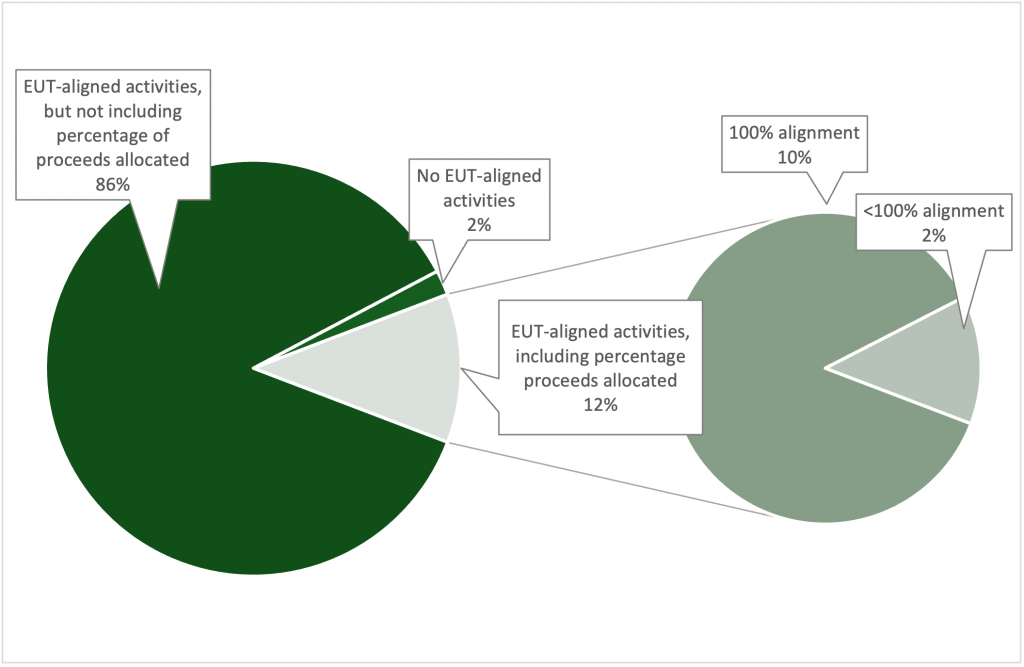
Note: Out of the sample of approximately 1,400 bonds, the pie chart on the left represents a subset of 258 bonds that have disclosures on EU Taxonomy.
Source: ISS Sustainability Solutions
Of the 258 bonds, detailed disclosures on proceeds allocation to EU Taxonomy-aligned activities were available for only 30 bonds, or 12% of the total. Further, of the 30 bonds for which detailed disclosures were available, 26 disclosed proceeds allocated to projects that are 100% aligned to EU Taxonomy-aligned activities, or 10% of the total. Finally, a further 4 bonds disclosed alignment to EU Taxonomy-aligned activities, but partially (2%).
With coverage expanding to include bonds aligned with the EU Green Bond Standard, in-depth disclosures from issuers may become more prominent in the future.
Conclusion
An issuance-level assessment allows investors to draw key insights on the material sustainability risks and opportunities of a labeled bond, rather than building an assessment on general elements from the issuer’s activities and performance. With the Sustainability Bond Rating, ISS’ Sustainability Solutions caters to a market gap and need for data analysis that can inform both investment decision-making and reporting for regulatory compliance.
Several key trends can be extrapolated from the trend analysis of the current assessed universe:
- Of the green bonds that constitute the majority of the universe, financing is mainly targeted towards renewable energy and the development of sustainable cities through green buildings.
- Of the social and sustainability bonds in this universe, key contributions are made towards improvement of educational and health facilities.
- With almost 64% of bonds in the universe not disclosing limitations on project refinancing, better disclosures may allow issuers to align better with the ICMA principles.
ISS’ Sustainability Solutions SBR solution enables holistic sustainability assessments by focusing on issuance-level disclosures and by supplementing key contextual datapoints. These sustainability assessments also include the ability to assess and compare labeled bonds worldwide while continuously expanding the covered universe.
Explore ISS STOXX solutions mentioned in this report:
- Access to global data on country-level ESG performance is a key element both in the management of fixed income portfolios and in understanding risks for equity investors with exposure to emerging markets. Extend your ESG intelligence using the ISS ESG Country Rating and ISS ESG Country Controversy Assessments.
- Identify ESG risks and seize investment opportunities with the ISS ESG Corporate Rating.
- Financial market participants across the world face increasing transparency and disclosure requirements regarding their investments and investment decision-making processes. Let the deep and long-standing expertise of the ISS ESG Regulatory Solutions team help you navigate the complexities of global ESG regulations.
- Use ISS ESG Climate Solutions to help you gain a better understanding of your exposure to climate-related risks and use the insights to safeguard your investment portfolios.
- Understand the impacts of your investments and how they support the UN Sustainable Development Goals with the ISS ESG SDG Solutions Assessment and SDG Impact Rating.

By:
André Noack, Methodology Specialist – Regulatory Solutions and Fixed Income, Sustainability Research
Rupali Goyal, Methodology Specialist – Regulatory Solutions and Fixed Income, Sustainability Research
Ria Modh, Methodology Specialist – Regulatory Solutions and Fixed Income, Sustainability Research
Héctor Páez, Team Lead, Methodology – Regulatory Solutions and Fixed Income, Sustainability Research