Introduction
Climate change is having a profound impact on the real estate market, with reporting and due diligence requirements increasing for real estate managers and investors as a result. Real assets are exposed to acute physical hazards stemming from climate change, such as tropical cyclones, wildfires, and floods, which can cause immediate physical damage. Such damage can result in repair costs (capital expenditure) and business interruptions that decrease revenues for commercial property assets. In the long term, assets in high-risk locations can also face asset devaluation and difficulties in securing insurance. Also, chronic physical hazards such as drought and extreme heat can lead to decreased labor productivity and increased operational costs for commercial assets.
Physical risks are accordingly being incorporated into building sustainability performance standards such as those of Leadership in Energy and Environmental Design (LEED) and the German Sustainable Building Council (DGNB). The Coalition for Climate Resilient Investment has proposed the Physical Climate Risk Assessment Methodology to facilitate the integration of physical climate risks into investment processes.
Asset-Level Impacts of Physical Climate Risk on Real Estate
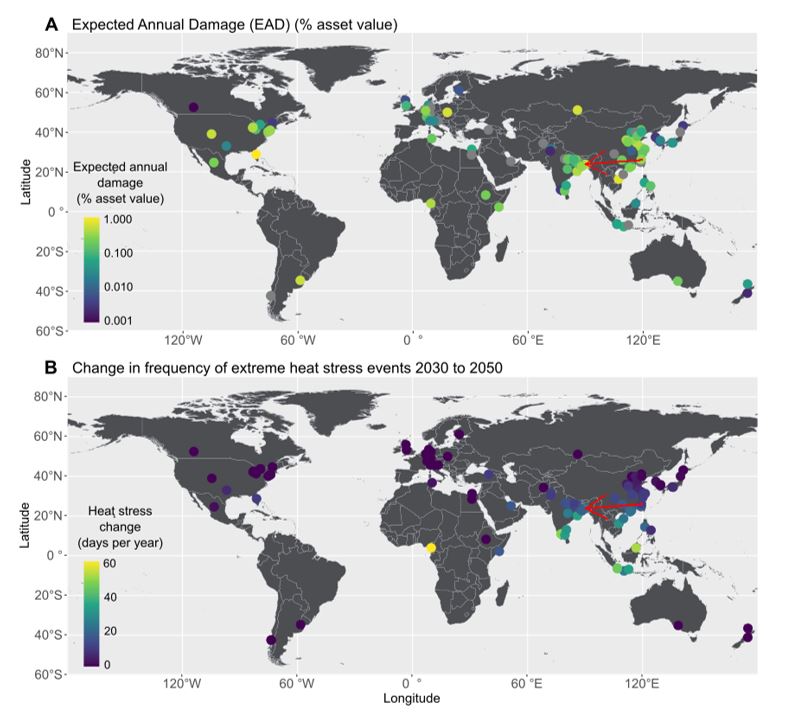
ISS ESG’s Physical Risk Real Asset Analysis, applied to a fictitious real estate portfolio of 100 assets globally distributed proportionally to the world’s population and gross domestic product (GDP) (Figure 1), allows for identifying assets at risk, describing the change in risk over time, and breaking down financial impacts by geography and hazard. Each asset has an equal weight of $1 million, for an overall portfolio total value of $100 million.
Figure 1: Global Portfolio of Real Estate Assets, with Modelled Future Damage due to Climate-Change Physical Risks

(A) Total annual damage due to acute physical hazards in 2050 in a likely warming scenario. Each circle represents an asset from a fictitious portfolio of 100 assets. The color indicates the total expected annual damage (as % of asset value) from river floods, coastal floods, tropical cyclones, and wildfires. (B) Change in frequency of extreme heat stress events (days per year) from 2030 to 2050 in a likely warming scenario. In both maps, the red arrow points to a showcase location in Dhaka, Bangladesh (see below).
Source: ISS ESG Physical Risk Real Asset Analysis
All portfolio assets are shown on a global map in Figure 1A, which color-codes the total annual damage in 2050 from acute physical hazards (expressed as a % of asset value) estimated by ISS ESG’s models for a likely warming scenario corresponding to the IPCC‘s Representative Concentration Pathway 4.5 (RCP 4.5), which predicts a 2-3 °C additional temperature rise by 2100. Damage is highest in tropical regions, with systematically higher values throughout India and coastal East Asia. For chronic hazards, mapping the change in extreme heat stress events between 2030 and 2050 (Figure 1B) shows that heat stress will strongly increase throughout India and Southeast Asia, with a peak increase of approximately 60 days per year for a location in Nigeria.
This location-based analysis is done at the asset-coordinate level. For instance, the asset marked by the red arrows in Figure 1, located in Dhaka, Bangladesh, is affected by all hazards and mostly by river and coastal floods. The models predict that risks at this location will increase significantly over time compared to historical risks (1980). By 2050, river flood damage costs will increase by over 30% in a likely warming scenario compared to 1980, the number of severe drought months will rise by over 50%, and the number of heat stress days per year will increase by more than 300%.
Portfolio-Level Impacts of Physical Climate Risk on Real Estate
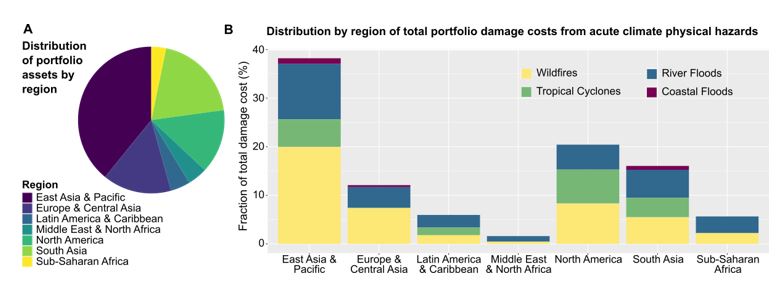
The chosen portfolio allocation follows global spatial patterns of population and GDP, such that most assets (and exposure) are in the East Asia & Pacific region, followed by South Asia, with Sub-Saharan Africa being the least represented region (Figure 2A). The portfolio’s geographical distribution of expected annual damage costs (Figure 2B) shows that more than half of all portfolio damage costs derive from assets in the East Asia & Pacific and North America regions, driven by wildfires and river floods and, significantly in North America, tropical cyclones. The next most affected region is South Asia, with 16% of all damage costs and a strong impact from river floods, wildfires, and tropical cyclones.
Figure 2: Distribution of Real Estate Portfolio Assets and Damage Costs

(A) Geographical distribution of portfolio assets by region. (B) Percentage of total portfolio damage costs by region from acute physical hazards in 2050 for a likely warming scenario.
Source: ISS ESG Physical Risk Real Asset Analysis
Investors may wish to evaluate asset concentration in high-risk areas and to improve their portfolio diversification by moving investments from regions of high risk to those of low risk. For instance, the North America region accounts for 20% of all portfolio damage costs despite representing only 13% of the total exposed asset value (portfolio weight), demonstrating that concentrating assets in high-risk areas could be an issue in this region.
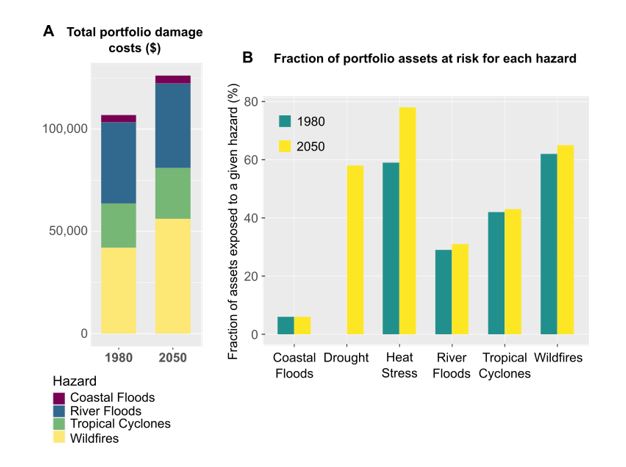
Looking at the overall historical damage costs for the entire portfolio due to the acute physical hazards and the cost breakdown by hazard (Figure 3A) shows that wildfires generate the largest costs, at approximately $42,000 per year on average, closely followed by river floods ($40,000/year), then tropical cyclones ($22,000/year) and coastal floods ($3,000/year). Total historical damage costs sum to $107,000/year, and modeling shows that they are expected to rise to $126,000/year by 2050, mainly driven by increases in wildfire damage.
Looking at the number of assets, out of the total of 100 assets, exposed to each hazard (Figure 3B) shows that a majority of assets (60-80% of assets) are at risk of heat stress, wildfires, and drought in 2050; moderate fractions of assets (30-40%) are exposed to river floods and tropical cyclones; and only 6% of assets are affected by coastal floods. The fractions of assets exposed generally increase over time. Chronic heat stress risk is the hazard most sensitive to climate change, with the fraction of assets exposed increasing from approximately 60% to 80% between 1980 and 2050.
Figure 3: Portfolio Damage Costs and Portfolio Assets at Risk

(A) Total portfolio expected annual damage costs ($) from acute physical hazards in the historical period (1980) and by 2050 for a likely warming scenario (RCP 4.5). (B) Fraction of portfolio assets exposed to each hazard in a likely warming scenario. For the acute hazards, an asset is at risk if the model predicts non-zero expected annual damage. For the chronic hazards, an asset is at risk if there are more than 12 months per decade of severe drought and a non-zero number of days of extreme heat stress per year.
Source: ISS ESG Physical Risk Real Asset Analysis
Conclusion
ISS ESG’s Physical Risk Real Asset Analysis can help investors understand how asset value and asset-related activities may be affected by natural physical climate hazards and how these effects may be exacerbated by climate change in different scenarios (RCP 4.5 and 8.5). A real-asset-specific assessment allows investors to evaluate and compare past and future risk exposure (historical, 2030, 2050) at specific locations, informing the development of effective risk-management and exposure-reduction strategies.
The analysis can be used for regulatory disclosures and reporting. Also, aggregations of the analysis by geography and hazard allow investors to identify regions and hazards that are susceptible to spatial risk concentration and support efforts to improve portfolio diversification. Investors can use the physical risk assessment to inform asset valuations; to plan for future asset-use changes driven by environmental changes such as increased heat stress and drought; and to develop plans involving asset-level costs such as insurance and building protection needs.
Explore ISS ESG solutions mentioned in this report:
- Use ISS ESG Climate Solutions to help you gain a better understanding of your exposure to climate-related risks and use the insights to safeguard your investment portfolios.
By: Dr. David A. Carozza, Physical Climate Risk Consultant, Climate Solutions, ISS ESG
Dr. Isabel Llorente Garcia, Physical Risk Team Lead, Climate Solutions, ISS ESG


