Total economic losses due to natural catastrophes increased by 26% in 2020 compared to 2019 and reached a 10-year annual average of $202 billion according to the Swiss RE Institute. While the world is still debating the required level of ambition to keep costs from climate change at a tolerable level, a new study finds the carbon emissions already in the air might be enough to exceed the Paris Agreement target to hold global average temperature increase to well below 2°C above preindustrial levels. Although the exact magnitude of warming is not clear yet, the question is not if, but by how much climate change will increase costs and affect the economy.
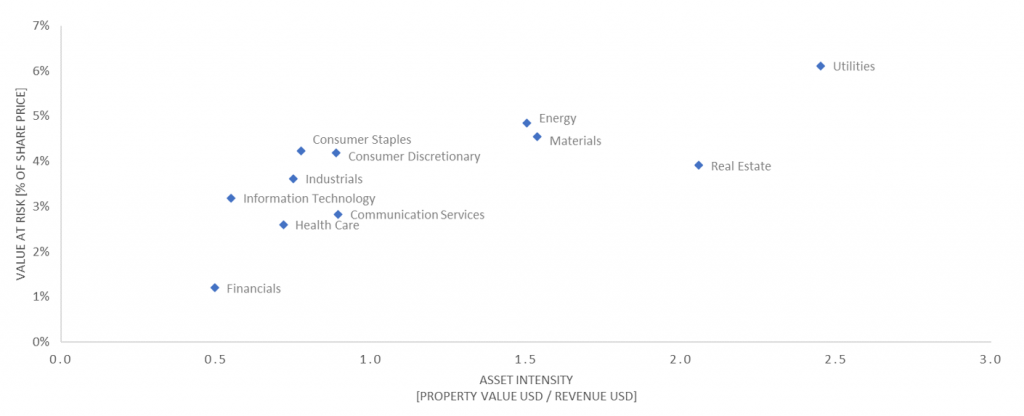
As an investor, it is key to understand a portfolio’s exposure to physical climate risks. There are different factors driving the magnitude of the physical climate risk, including a company’s geographical footprint (“Where are they active?”) and the nature of its business activity (“What are they doing?”). One component that stands out as a driver of the magnitude of physical climate risk is asset intensity, i.e., the total value of property used to generate a certain amount of revenue. Generally, the higher the asset intensity, i.e., the more property is needed to generate revenue, the higher the value at risk (see Fig. 1 below). This means that certain sectors, such as the utilities or the energy sectors, are more exposed to value losses than others. This can be explained intuitively as companies that hold a lot of value in physical assets are exposed to those assets being affected by hazards.
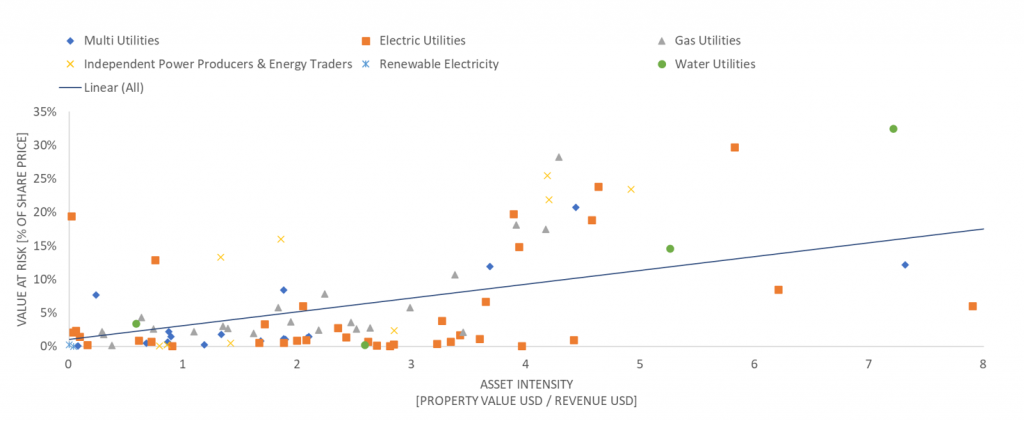
The link between asset intensity and value at risk can be observed not only between different sectors, but also within them. For the example of the utility sector, companies with a particularly high asset intensity often show a high value at risk (see Fig. 2 below). A wide range of asset intensities between companies also exists within the subsectors. This is a particularly relevant perspective for investors aiming at a sector diversified portfolio as it allows investors to optimize exposure while keeping the sector allocation stable.
Interestingly, around an asset intensity of 4 to 5 there is a wide range in the corresponding value at risk. Analyzing companies exclusively with an asset intensity above 3.5 showed that companies with a lower value at risk (between 10 to 20%) were more than twice as geographically diversified as companies with a higher value at risk (> 20%). This means that geographically diverse companies are generally less risky, as they can better compensate a loss in one region with their operations in others.
This shows that the asset intensity is one of the interesting factors that influence a company’s exposure to physical risks. Further factors included in ISS ESG’s Climate Physical Risk Analysis are, for example, the geographical distribution, supply chain dependency, rent vs. ownership ratio, etc., as well as a physical risk management strategy.
Find out more about ISS ESG Climate Solutions.
By Patricia Dörig, ESG Consultant, ISS ESG