
Key Takeaways
- Avoided emissions (AE) offer an opportunity‑oriented complement to today’s risk‑focused climate assessments by highlighting the broader decarbonization potential of portfolios.
- To derive AE metrics that investors can rely on, it is essential to have a consistent allocation approach to producing AE estimates that represent distinct, non‑overlapping contributions.
- Although physical‑activity‑based methods are preferred by the Partnership for Carbon Accounting Financials (PCAF), economic-intensity-based methods may be better suited to support allocation of AE along the value chain. Economic intensity-based methods can reduce greenwashing risk and support opportunity-driven capital allocation toward real‑economy decarbonization.
- A comparison of AE estimates, with and without allocation, for solar utilities shows the inflated AE estimates that can arise without allocation.
Introduction
Avoided emissions (AE) quantify the positive greenhouse gas (GHG) impact of a product relative to a counterfactual scenario in which that product does not exist. In effect, they represent emissions that never occur because a lower carbon solution displaces a higher emitting alternative. For investors, AE offer an opportunity‑oriented complement to today’s risk‑focused climate assessments by highlighting the broader decarbonization potential of technologies beyond their operational footprints and informing transition‑aligned capital allocation.
For AE metrics to become robust and decision‑useful rather than serving only as a directional signal, there is a clear need to allocate each company’s proportional contribution along the value chain to a product’s lifecycle AE impact. Existing guidance from Partnership for Carbon Accounting Financials (PCAF), World Business Council for Sustainable Development (WBCSD), Institute of Life Cycle Assessment (ILCA), and the GHG Protocol highlights the resulting risk, particularly at the portfolio level, of multiple counting and greenwashing when allocation is absent.
This article examines the trade‑offs of different approaches to estimating and allocating AE in practice, evaluates their alignment with existing guidance, and proposes revenue‑based allocation as a scalable option for producing credible, portfolio‑level AE metrics.
Why Allocation Is Essential for AE Credibility
Because AE represents lifecycle impacts shared across multiple actors, a consistent allocation approach is essential. In current practice, however, many companies report the entire AE impact of a product rather than their proportional contribution. This practice can result in multiple counting when aggregated at the portfolio level, where the same AE are claimed by several actors across the value chain. The result can be inflated totals and potential greenwashing risks, as highlighted by the WBCSD.
For example, if a solar project delivers 100 tCO₂e of actual AE, but the utility, the inverter manufacturer, and the module supplier each report the full 100 tCO₂e, a portfolio holding all three could appear to deliver 300 tCO₂e. An allocation approach instead allocates shares of the same 100 tCO₂e across all life-cycle contributors (Table 1).
Table 1: Sample Allocation Approach for Avoided Emissions (AE)
| Actor | Role | Reported AE (tCO2e) | Allocated AE* (tCO2e) |
| Utility – Electricity production | Solution | 100 | ≈ 30 |
| Inverter manufacturer | Enabler | 100 | ≈ 5 |
| Module supplier | Enabler | 100 | ≈ 10 |
| Other solar value chain | Enabler | 100 | ≈ 55 |
*Illustrative allocation for explanatory purposes only.
Note: A solution directly reduces greenhouse gas emissions; an enabler indirectly reduces such emissions.
Source: ISS STOXX
The risks associated with accounting of AE are acknowledged by various frameworks:
- WBCSD recommends allocation at the company level and requires that AE aggregation avoids multiple counting.
- ILCA requires allocation at the company level.
- PCAF recommends separating portfolio-level disclosure for climate solutions and enablers.
Allocation is fundamental to producing AE estimates that represent distinct, non‑overlapping contributions and that investors can rely on for investment decision‑making, capital stewardship, and alignment with real‑economy decarbonization.
Physical‑Activity‑Based AE Estimation
When reported data are limited, PCAF’s supplemental guidance prioritizes physical activity over economic‑intensity‑based estimates, due to the perceived uncertainty of the latter. Physical‑activity‑based estimation, in which activity data are paired with emissions factors and conservative counterfactuals, works well in sectors such as utilities, where disclosures are mature and data availability is high.
However, this focus on physical activity reinforces an existing imbalance in the maturity of company‑level AE reporting, where solution providers, which directly reduce GHG emissions, tend to lead while enablers, which indirectly reduce emissions, lag due to less consistent disclosure of physical metrics.
Physical‑activity‑based methods also face fundamental structural barriers when applied across the value chain. Actors report activity in incompatible units, such as GWh for utilities, MW for module manufacturers, and tons or count for inverter manufacturers. Such reporting requires conversions that rely on non‑standard assumptions and undermine comparability.
Further challenges arise from avoiding multiple counting. PCAF recommends that avoided emissions be derived from physical units, but choosing a single physical denominator to allocate system‑wide benefits inevitably distorts results. Allocation by GWh places nearly all credit with utilities; allocation by weight or volume shifts credit upstream to materials suppliers.
Table 2: Sample of Distortions Arising from Physical Activity-Based Estimations of Avoided Emissions
| Actor | Physical Activity Disclosure Unit | AE by Allocation Approach (tCO₂e) | ||
| By Energy Production | By Weight/ Volume | By Produced Capacity | ||
| Utility – Electricity production | GWh | 100 | 0 | 0 |
| Inverter manufacturer | Count/Weight | 0 | 0 | 20 |
| Module supplier | MW | 0 | 0 | 60 |
| Upstream material suppliers | Weight/ Volume | 0 | 100 | 0 |
Source: ISS STOXX
Because physical activity units are not consistent or comparable across the value chain, they cannot support a unified, scalable allocation approach.
A credible allocation framework should proportionally recognize all contributors to a product’s lifecycle impact, ensuring transition finance flows throughout the value chain. Yet the limitations of physical‑activity data—incompatibility, inconsistency, and sensitivity to unit selection—make such data poorly suited to fulfill this role, limiting their utility as a signal for real‑economy decarbonization.
The Case for Economic Intensity-Based Estimation
Economic intensity-based estimates, i.e., allocating the lifecycle AE benefits per unit of economic output, offer meaningful advantages. Unlike emissions factors per unit of physical activity, economic intensities can provide a non‑duplicative basis for distributing AE credit proportionally along a value chain and also draw on financial data that is more widely available than physical data (Table 3).
Table 3: Sample of Economic Intensity-Based Estimations of Avoided Emissions
| Actor | Economic Intensity (AE tCO2e/M Revenue) | Issuer Revenue from the Solution (M Rev) | Allocated AE* (tCO2e) |
| Utility – Electricity production | 6000 | 5 | 30,000 |
| Inverter manufacturer | 2000 | 2 | 4,000 |
| Module supplier | 2000 | 1 | 2,000 |
*Illustrative only.
Source: ISS STOXX
An illustration of regulatory guidance around estimations and the allocation approach for AE is presented in Table 4 to highlight that both economic intensity-based estimations and revenue-based allocation could be allowed under guidance that predates PCAF’s recent recommendations.
Table 4: Guidance on Estimation and Allocation of Avoided Emissions
| Guidance | Recommended Estimation Approach | Is allocation recommended? | What form of allocation is permissible? |
| PCAF | Prioritizes physical activity-based over economic intensity-based estimations | No recommendation | N/A |
| WBCSD | Prioritizes primary (i.e., production or economic output) over secondary (i.e., grid emissions factors) data sources | Recommends that portfolio‑level aggregation avoids multiple counting | Economic proxies allowed if exact contribution cannot be determined |
| ILCA | Prioritizes calculations based on sales volume, over production or shipping volume | Recommends company-level allocation | Value‑added-based allocation recommended |
| GHG Protocol | Preferences primary over secondary data, among other quality indicators | Recommends company-level allocation | Percentage agreed upon with value‑chain partners. |
Source: ISS STOXX
At this point, it is useful to address PCAF’s concerns regarding economic‑intensity–based estimates directly:
- Greenwashing: Economic intensity-based methods may, in practice, reduce greenwashing risks by preventing the inflated AE estimates that arise when physical activity-based approaches cannot allocate AE along the value chain.
- Uncertainty: Physical metrics could introduce uncertainties comparable to economic intensity-based ones, particularly via the conversion of incompatible units, or where physical output must be back‑calculated from financial disclosures (e.g., converting EV revenue into vehicle counts).
Economic intensity-based methods could therefore be recognized within data‑quality frameworks, even if initially assigned a lower PCAF quality score (such as 4 or 5). As allocation methodologies become standardized, economic intensity-based approaches may be elevated to a higher data quality score.
Table 5 below summarizes the respective use‑cases and trade‑offs of both approaches relative to the reported data.
Table 5: Comparing Estimation Approaches and Reported Data
| Criteria | Economic Intensity-Based Estimation* | Physical Activity-Based Estimation / Emission Factors Database | Reported AE |
| Description | Product-level estimates of avoided emissions intensities are applied to revenue data. | Emissions factors are applied to manually collected product data. | Data is sourced from separate company filings. |
| Product types | Solutions and Enablers | Best suited to Utilities, possible for Solutions and Enablers (depending on data availability) | Primarily Energy, specifically Utilities |
| System boundary | Should be a lifecycle figure | Varies based on data availability | Typically non-lifecycle |
| Portfolio-level aggregation/ Allocation | Revenue-based allocation; no multiple counting | Multiple counting unless allocation is added | Multiple counting |
| Main advantage for investors | Company-level allocation of AE across the value chain | Reliability and maturity of underlying data; alignment with PCAF guidance; highly granular where data exist | Responsibility remains with the reporting entity |
| Main disadvantage for investors | Not eligible for a PCAF score given that PCAF disallows the use of economic intensities | Resource‑intensive, manual data collection | Cannot be reliably aggregated at the portfolio level |
* Based on the specific application of this approach considered in this article
Source: ISS STOXX
A Case Study Comparing Allocation Approaches for Solar Utilities
The availability of both methodologies allows for a direct comparison of AE estimates with and without allocation, applied here to solar utilities. In Figure 1, each point represents a single utility’s avoided emissions in tCO₂e, calculated both with allocation (y‑axis), which allocates AE according to the revenue the utility extracts along the chain, and without allocation (x‑axis), where the utility is credited with the full AE benefit of the entire value chain.
Figure 1: Estimated Avoided Emissions from Production by Solar Utilities (mil tCO2e), with and without Allocation
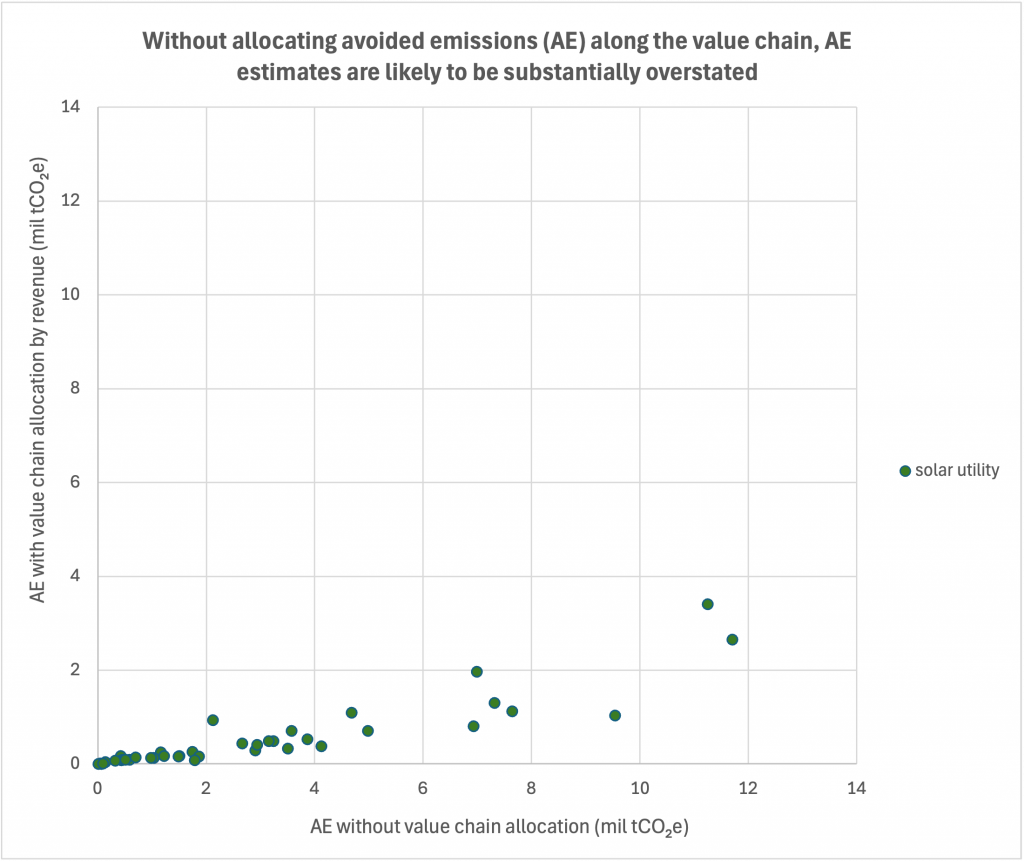
Note: Although adjustments were made to improve comparability, minor baseline differences remain and so should only be interpreted directionally.
Source: ISS STOXX
As expected, allocating all AE to utilities often produces significantly higher values than distributing credit by revenue; the slope of the scatter indicates that when the full lifecycle AE is allocated to utilities, the resulting figures can be approximately three to six times higher than those obtained when credit is apportioned based on revenue share.
While PCAF’s latest guidance does not require issuer‑level allocation of AE, the comparison shows that an allocation framework producing issuer‑level metrics that reflect a proportional contribution may be better suited to support opportunity‑driven capital allocation toward real‑economy decarbonization.
Conclusion: Toward a Credible, Scalable Allocation Framework
A credible allocation framework for AE must balance methodological rigor with practicality across value chains. Physical activity-based estimates are valuable where disclosures are mature, but they cannot easily resolve allocation challenges. Economic‑intensity‑based approaches offer a scalable, non‑overlapping way to allocate AE proportionally using widely available financial data.
Standards that enable emission intensity-based allocation alongside transparent lifecycle assumptions could strengthen integrity and usability and align investor metrics with real decarbonization outcomes.
By:
Kyra Frederick, Senior Associate, Climate Research & Analytics