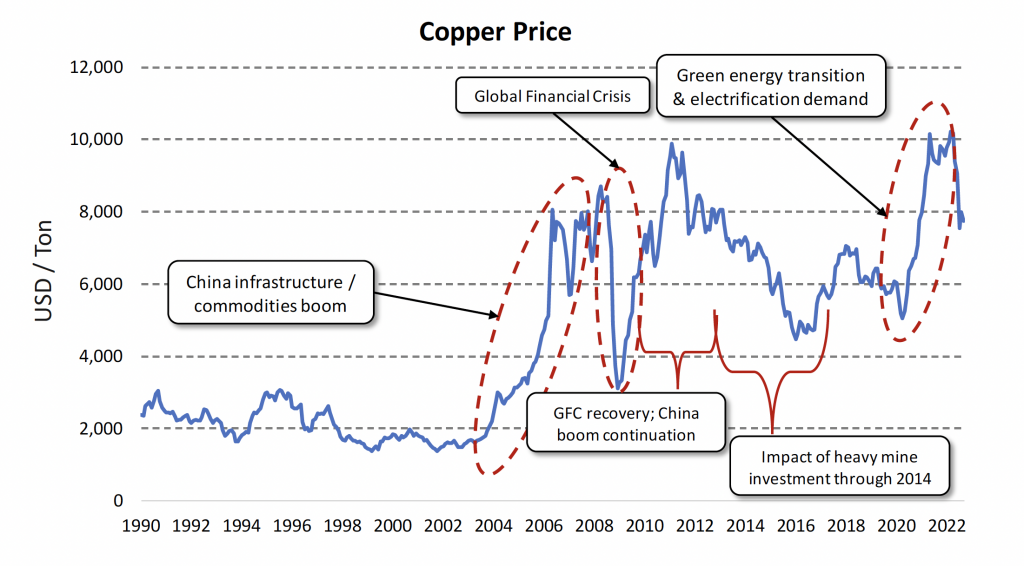
Arguably less problematic than cobalt and lithium, copper still has a number of environmental, social and governance (ESG) and supply chain challenges ahead of it. Copper’s high thermal and electrical conductivity have made it an indispensable metal since the industrial revolution. It plays a critical role in the electrical grid (for example in power lines), electricity consumption (in EV motors), and electricity generation (in wind turbine generators). A single 5MW wind turbine can require 18 tons of copper or more. To achieve Net Zero or any scenario close to that, the world will need significantly more copper than is produced today. The energy transition has already brought tightness to the copper market, as shown by the price rise after 2020 in Figure 1. While prices have since fallen with a global economic slowdown, prices remain elevated.
Figure 1: Copper Price History Since 1990: Despite Recent Global Slowdown, Price Remains Elevated
Source: St. Louis Federal Reserve, ISS ESG
As discussed below, expansion of renewables is likely to require greater copper production. This increased production brings with it environmental and societal concerns, however, including water usage, waste, and chemical pollution. On the positive side, copper has less single-source risk than for other transition commodities ISS ESG has reviewed, particularly cobalt and lithium.
Demand Drivers
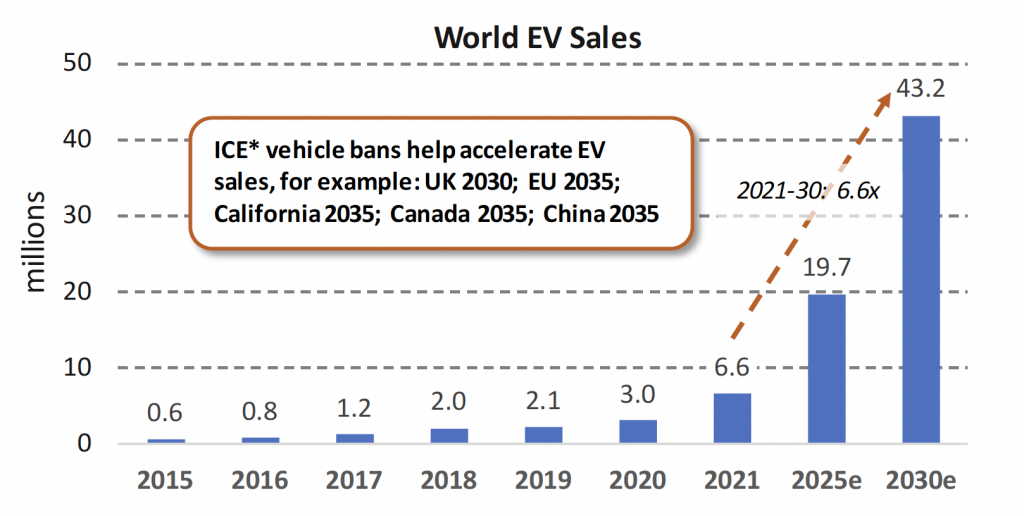
Electrification of the transport system and renewables expansion drive future copper demand. Figure 2 shows the International Energy Agency (IEA)’s forecast of new electric vehicle (EV) sales through 2030, growing by a factor of 6.6x from 2021 to 2030. EVs use significantly more copper than internal combustion engine (ICE) vehicles.
Figure 2: EV Growth Over the Coming Years Is Just One of Several Demand Drivers
Source: IEA, ISS ESG
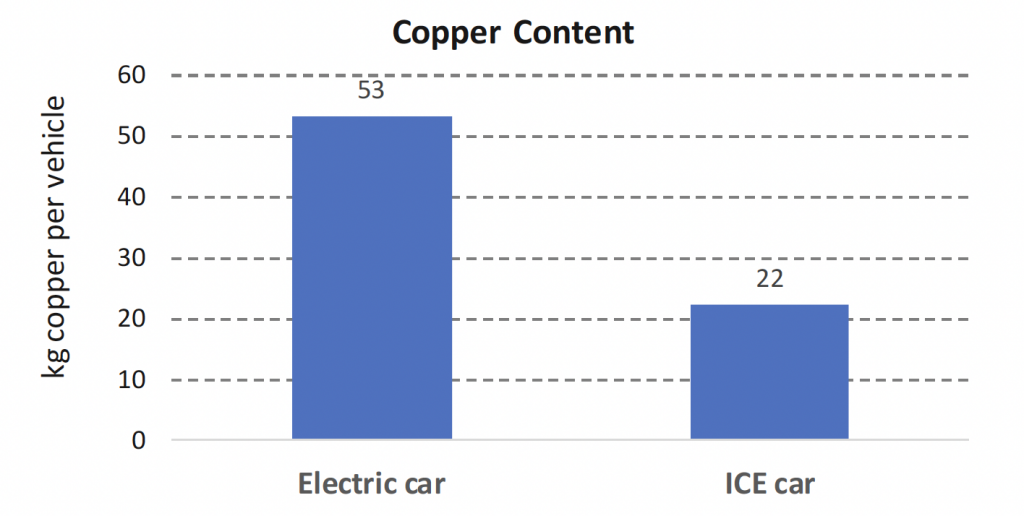
Figure 3 shows that EVs utilize roughly 30kg more copper per car. This represents significant new demand over the coming years. Were we to replace 100% of global car sales (80 million cars globally), it would represent 2.4 million tons of incremental annual copper demand, or about 10% of current global copper production.
Figure 3: EVs Use Considerably More Copper than ICEs
Note: ICE = internal combustion engine
Source: USGS, IEA, ISS ESG
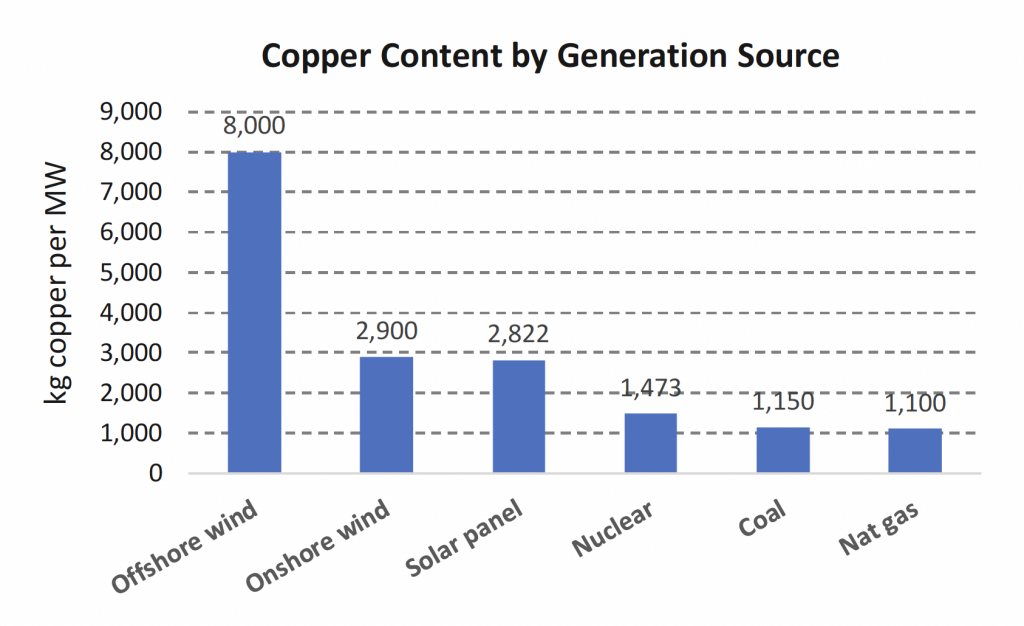
Renewables generation and related infrastructure also add demand. Figure 4 shows copper content per megawatt (MW) of capacity for renewables and legacy electricity generation sources. The advantage of removing fossil fuel from electricity generation is balanced by a greater requirement for copper and other critical metals. Solar and onshore wind require over 2x the amount of copper per MW versus fossil fuel and nuclear generation. Offshore wind is significantly more, over 6x. The metal intensity of wind technology arises from copper use in the generator (inside the turbine itself), power transformers, cabling, and subsequent connections to a substation and the local transmission network. Offshore turbines tend to be larger and have additional connectivity and an offshore substation in addition to the standard terrestrial connections.
Figure 4: Renewables Require Additional Copper Investment
Source: IEA, ISS ESG
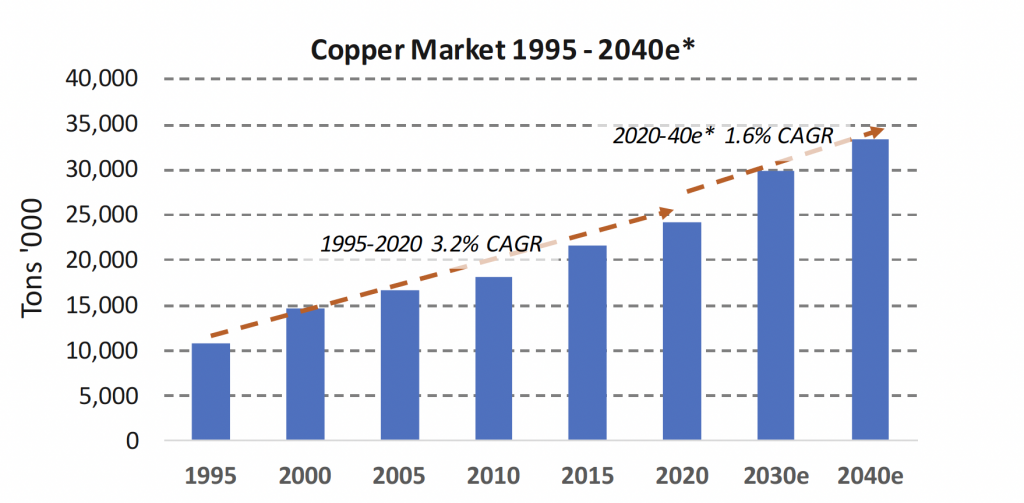
IEA predicts copper demand rising by almost 6mtpa (21%) by 2030 and over 9mtpa (35%) by 2040, according to its Sustainable Development Scenario. Historically, copper demand has grown approximately in line with GDP growth – a 3.2% 1995-2020 CAGR for copper demand relative to 2.9% world GDP growth over the same period. In contrast to materials like steel and cement, which go largely to construct infrastructure, copper is more associated with consumer demand as electricity consumption grows and demand for consumer goods expands, for example refrigerators, air conditioners, and heating. These products in turn require additional investment in the electrical generation and distribution grid. Going forward, the World Bank expects a longer-term average global GDP growth rate of 3.0%, implying a similar copper demand growth rate. Given renewables add another source of demand growth, however, the IEA’s copper demand outlook appears conservative.
Figure 5: IEA Copper Demand Rises over 8MT by 2040, but This Looks Conservative
* estimates are IEA Sustainable Development Scenario
Source: USGS, IEA, ISS ESG
Were copper demand only to match its historical growth rate, there would be a cumulative expansion of 37% by 2030 and 88% by 2040. But what about supply?
The Supply Challenges
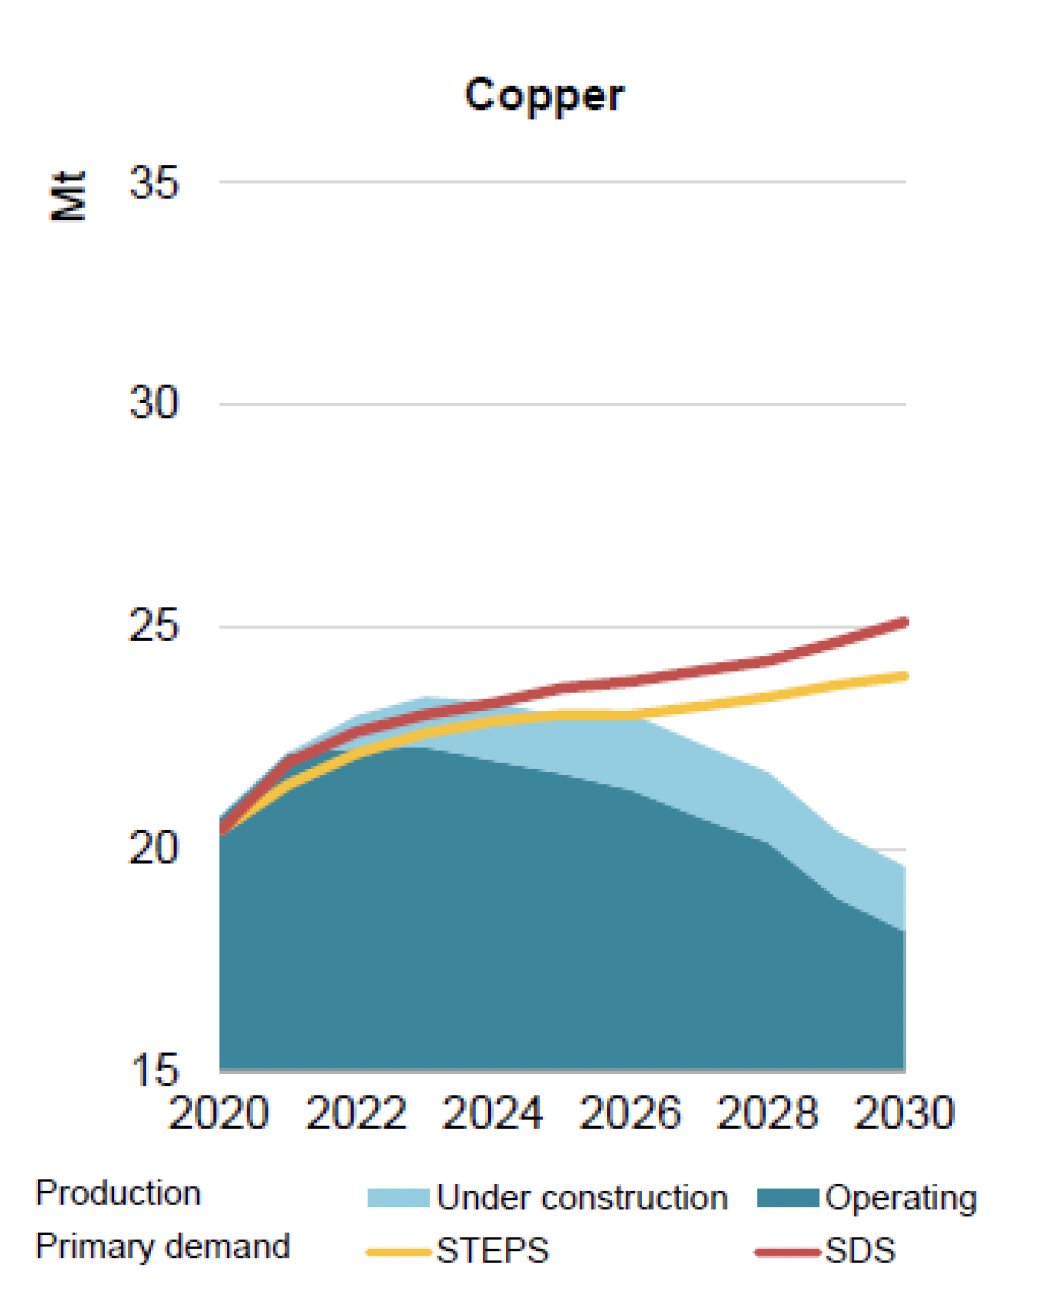
Copper supply may struggle to keep up with demand. Figure 6 shows IEA’s forecast copper demand for their Stated Policies scenario (STEPS) (in yellow) and their Sustainable Development Scenario (SDS) (red), versus the operating copper mine production (dark teal), and expected new mine production (light teal).
Figure 6: Copper Supply Requires Significant New Projects to Meet Demand
Source: IEA
Even on the IEA’s relatively conservative copper demand outlook, the world could soon face a copper deficit without significant new supplies coming online. Existing production is facing a decline due to lower ore grades. New production is challenged by a dearth of quality discoveries, longer planning and permitting times, and understandable opposition from affected communities. According to the IEA, mines coming online between 2010 and 2019 took an average 16 years to go from discovery to first production. That period will only rise as new projects face mounting environmental and social concerns.
Supply: Limited Single-Source Risk
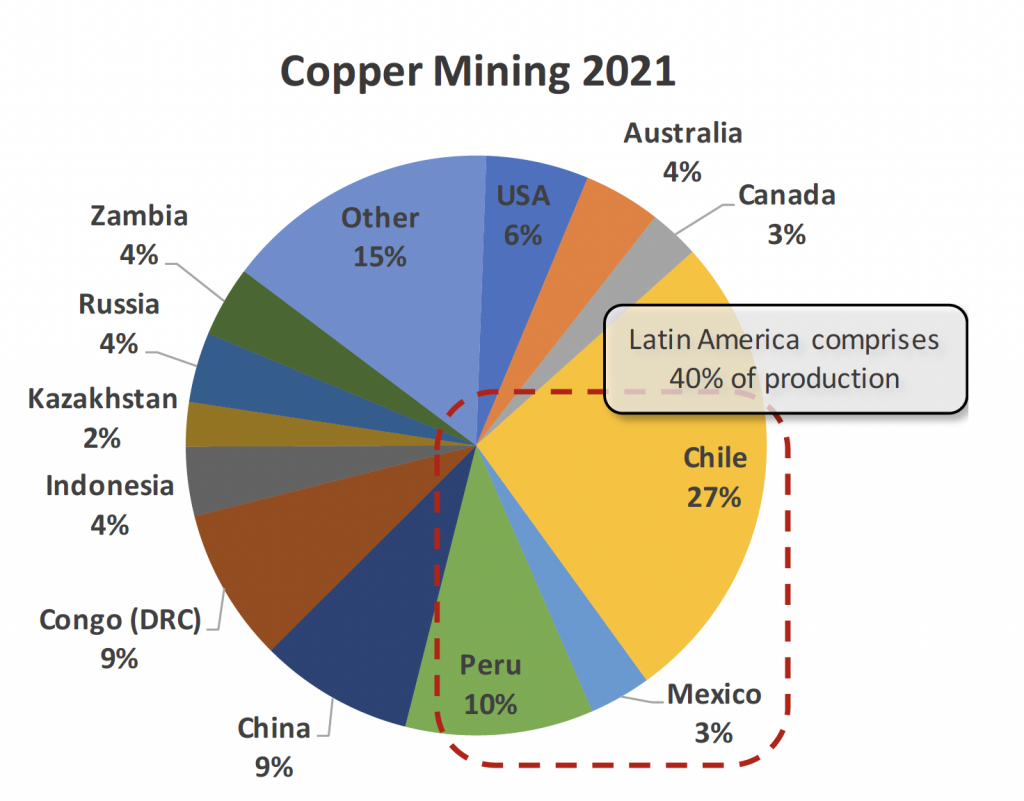
Copper production is more geographically diverse than other critical metals, a positive. Figure 7 shows copper mine production globally. While Latin America has a large portion of total supply at 40%, that is still significantly less concentrated than cobalt (>70% in the Democratic Republic of Congo) and lithium (the top two producers, Chile and Australia, account for almost 70%). Greater geographic diversity represents less supply risk in the event of natural disaster or conflicts.
Figure 7: Latin America is the Largest Producer, but Only 40% of World Production
Source: USGS, ISS ESG
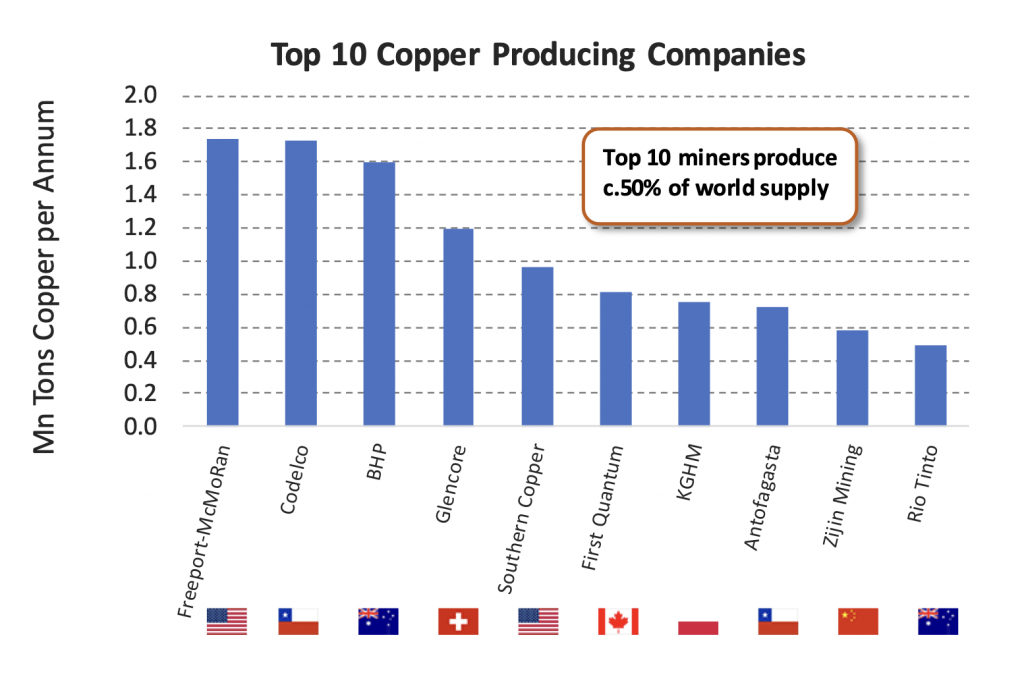
Copper production among miners is also relatively well spread, contributing to a reduced single-source risk. Figure 8 shows the copper production of the top 10 miners globally. Four companies produce more than 1 million tons per year, based in four different countries. Remarkably, 9 of the top 10 copper producers are based in OECD countries with generally well-developed mining codes.
Figure 8: OECD-based Companies Dominate Top Copper Producers
Note: production numbers as of 2021
Source: Company Reports, ISS ESG
The ESG Concerns: Chemicals, Tailings, Water Usage
Copper extraction and processing brings a range of environmental hazards impacting local communities and ecosystems. The scale of open-pit mining requires significant land use, entailing loss of wildlife habitat, deforestation, and biodiversity. According to recent studies, copper mining has the highest biodiversity impact of any clean energy metal, with a measurement of biodiversity impact (MiBiD) intensity score almost twice as high as the second most impactful. Copper mines and refineries are also associated with considerable air pollution through dust, NOx and SOx emissions, high energy and water intensity, and significant greenhouse gas emissions.
Extraction and processing are also chemically intensive. Copper from copper sulfide mines use sulphuric acid and other chemicals in extraction and treatment processes. These processes can create acid mine drainage (AMD), contaminating local communities. For example, in 2015 Zambian villagers brought legal claims to the UK high court against a local subsidiary of a UK mining company. The case alleged acid pollution from the Nchanga Mine in Zambia had entered local river systems, destroyed farmland and aquatic life, and made the area “uninhabitable”. Villagers also claim that consumption of fish from the rivers left villagers with long term health implications due to the ingestion of toxic chemicals from the mine. The case was subsequently settled in 2021. Similarly, in Mexico in 2014, 11 million gallons of chemical waste from the Buenavista copper mine was spilled into the Bacanuchi and Sonora rivers, contaminating waterways, killing livestock and damaging the health of nearby residents.
Copper ore produces more waste rock compared to other mines due to low ore grades that have been further declining in recent decades. Such waste is traditionally contained in an embankment dam storage facility, in order to minimize the risk of contaminating nearby soil and water bodies with toxic mineral waste including other heavy metals such as arsenic, lead or cadmium. However, high-profile dam failures in recent years have served to highlight the potential risks posed to nearby communities.
Waste storage is becoming a greater long-term issue as some studies estimate that the average copper ore grade has decreased by approximately 25% in the past ten years. Extractors need to process more material for the same quantity of copper, creating more waste to be stored in larger tailings dams. A recent dam breach at the Mount Polley copper and gold mine in Canada sent 24 million cubic meters of mine waste into a nearby lake that served as a food source for surrounding indigenous communities. The high profile collapse of the Brumadinho tailings dam in Brazil caused widespread environmental devastation and claimed the lives of around 270 people. Plans for new mines have since been met with opposition from locals, particularly indigenous communities, who cite such failures as evidence of the high social impact of mining.
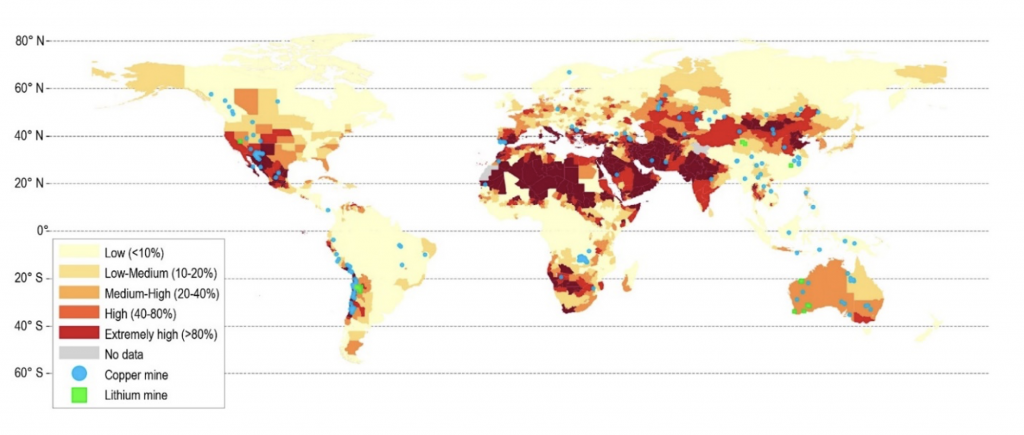
Mines often share water resources with local communities in areas with high water stress, as shown in Figure 9. This can lead to conflict, particularly in high water-stress areas, as well as contributing to local community unrest and production halts. Out of the 2021 top 20 copper mines by capacity, half are in high or extremely high-water stress areas, or in arid climates where there aren’t many water sources (based on the World Resources Institute (WRI) Aqueduct tool).
Figure 9: Over Half of Copper Mines Are Located in High Water Stress Areas
Source: Company Reports, ISS ESG
In 2021 this amounted to 4,561kt of copper, or approximately 22% of global production. Further, recent research by the Australian Sustainable Minerals Institute estimates that of the top 300 undeveloped copper orebodies globally 65% are in high water risk areas.
Water misuse can result in legal action from governments, posing risks to mine operations. In March 2022, Escondida, the world’s largest copper mine, encountered this risk in the form of an approximately $8.2 million fine. The Chilean Environmental Regulator (SMA) deemed that in the period from 2005 to 2019, Escondida had breached the water usage criteria of their environmental permit, causing irreparable damage to the Monturqui aquifer.
Desalination plants provide a solution to some water issues. Desalination plants require significant CAPEX, with most projects from the top 20 mines costing at least $1 billion. Escondida’s second desalination plant (with capacity of 2,500 liters/second) cost nearly $3.5 billion. Such a substantial outlay could only be warranted by a large and productive mine. As most large copper deposits are inland, building a desalination plant also requires constructing a long pipeline from the mine site to the ocean, sometimes located hundreds of kilometers away.
While expensive, desalination plants ensure a stable water supply to the mine, and can have a positive impact on its social license to operate. According to a report from the Chilean Copper Commission (Cochilco), the use of seawater in mining is predicted to increase approximately 167% by 2032, and freshwater use is expected to decrease by 45%. Seawater would amount to 68% of the total water used in mining in 2032. 6 of the top 20 mines by capacity either already obtain their water from desalination plants, are planning to, or are in the process of construction, including Escondida, Collahuasi, Minera los Pelambres, Chuquicamata, Los Bronces, Radomiro Tomic.
An alternate solution to water supply issues is to build a Wastewater Treatment Plant as Freeport-McMoran did for its Peruvian Cerro Verde mine. The mine considered building a desalination plant, but instead spent $550 million on a 1.8 cubic meters/second Wastewater Treatment Plant. Instead of using a common source of water with the farmers, Cerro Verde used wastewater and provided a new water source to use in local agriculture. The plant collects the effluent in the town of Arequipa: 50% of the treated water goes to Cerro Verde, and the other half is used in local agriculture. This has improved the relationship with the local communities.
ESG Ratings for Top Copper Producing Nations and Companies
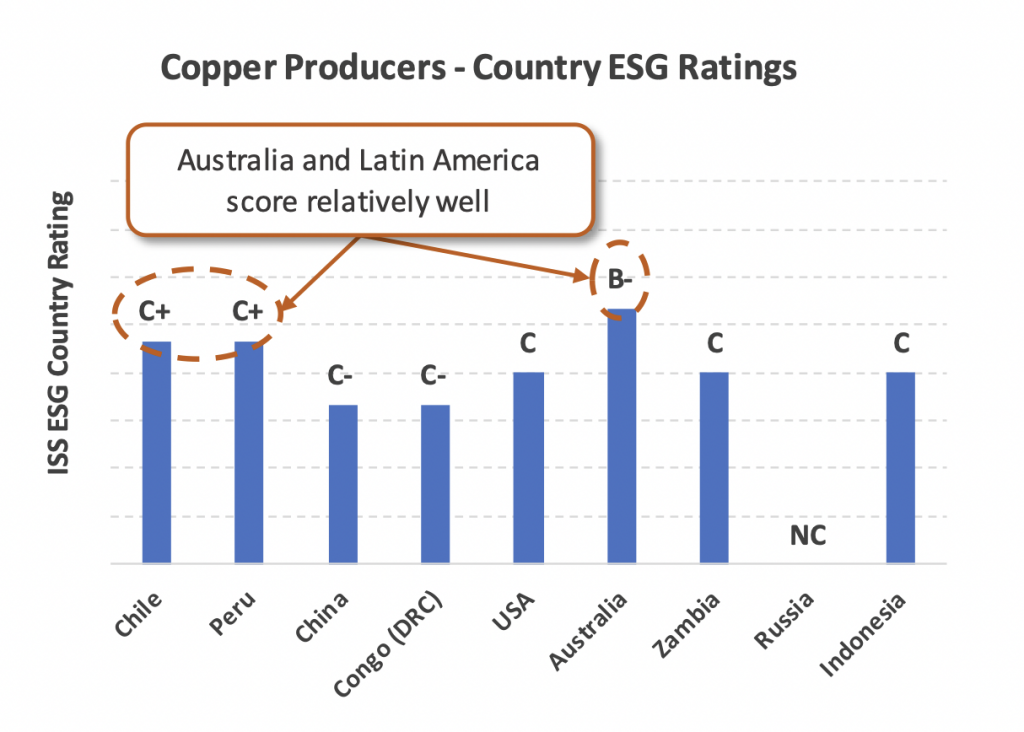
The positive news: the two top copper producing countries have better than average ESG ratings. Figure 10 shows ISS ESG letter scores (ranging from A to D) for the top copper producing countries. Notable are Australia, Chile, and Peru with reasonably solid scores. Investors have ample choice in screening for solid country ESG performance.
Figure 10: Several Producing Nations Have Solid ESG Ratings
Source: ISS ESG
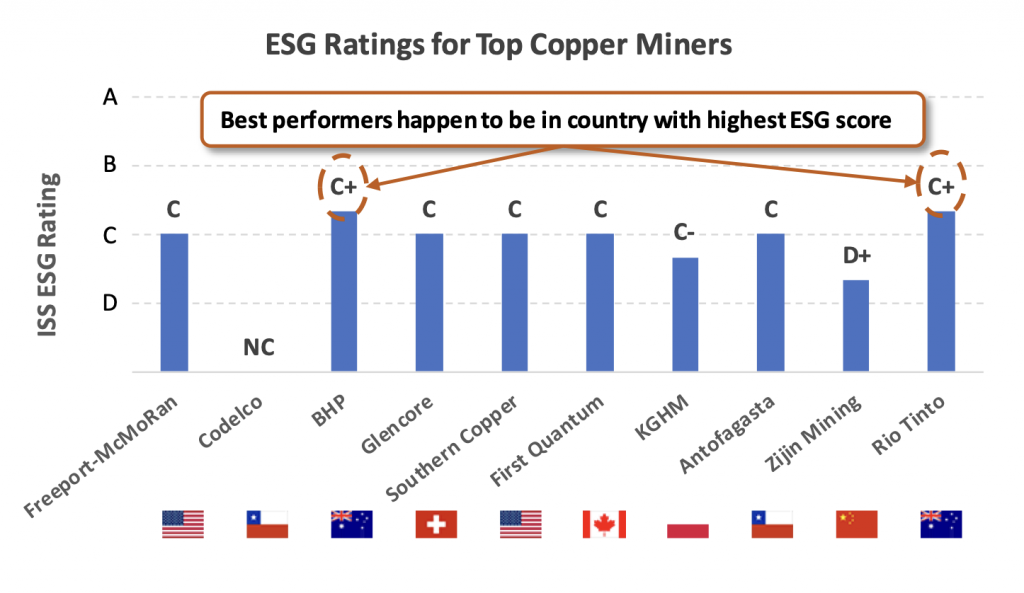
Australia’s two largest diversified miners outperform their peers, although only mildly. Figure 11 shows the ISS ESG Corporate Rating for the world’s top 10 copper miners.
Figure 11: Copper Miners Have Mostly Middling ESG Ratings
Source: ISS ESG
Australian diversified miners BHP and Rio Tinto outperform mildly with C+ scores and sit within the top 20% of their overall peer group (Mining & Integrated Production). The two companies share solid governance and business ethics scores, offset by climate protection factors that could be better. Not coincidentally, both are based in Australia, a country with solid ESG credentials, according to its ISS ESG Country Rating of B-.
Norms-Based Controversies: Chile and Peru Have the Most
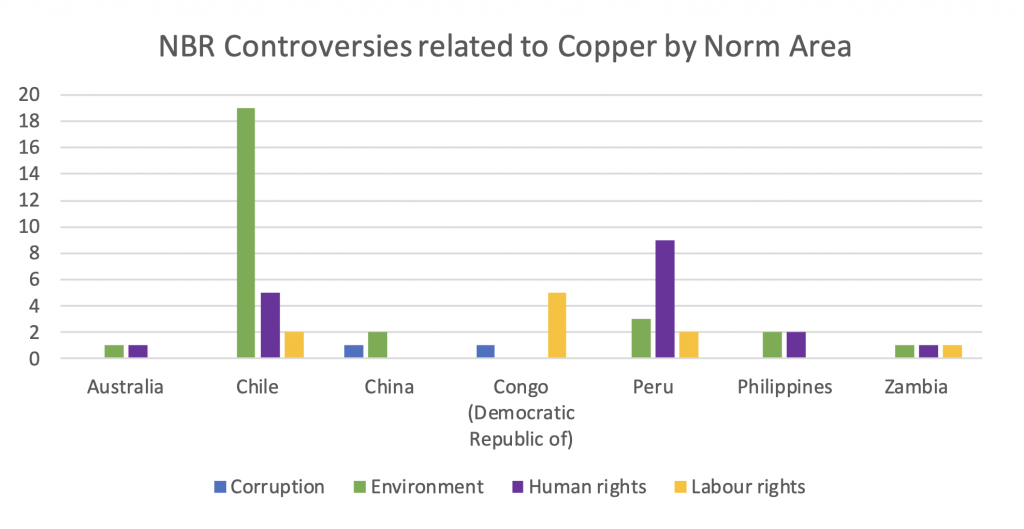
At first glance, ISS ESG’s Norm-Based Research (NBR) controversies analysis seems rather negative for Chile and Peru. Figure 12 shows the NBR team’s assessment of controversies for copper among the top-producing countries.
Figure 12: Chile and Peru Show a Higher Number of Controversies, Partly Due to Transparency
Source: ISS ESG
At first it seems counter-intuitive that two countries, Chile and Peru, with higher-than-average ESG scores (ref. Figure 10 above) show the highest number of controversies, while ESG laggard countries show fewer controversies. Countries with greater political freedom and an independent press will sometimes show higher controversy counts because of greater transparency levels, however. The absence of controversies in places like Congo (DRC) and China do not necessarily mean there is an absence of environmental and labor rights issues, but rather that they are not being reported or cannot be verified. Nonetheless, the high number of environmental controversies in Chile does indicate the high impact of mining in that country. Large open-pit copper mines risk great impact on their surrounding communities and environment. On a positive note, despite Peru and Chile’s dependence on mining for export flow and jobs, the NBR team identified no corruption controversies associated with copper in either country.
Fortunately, for those investors interested in exposure to copper, there is a range of choices for positive ESG performance. Unlike the several supply chain risk and related concerns the ISS ESG team identified in an earlier report on cobalt, copper production has greater diversity and significant production by solid ESG performers located in countries with respectable ESG profiles. Copper supply may run up against significant challenges as demand outstrips supply. But growth in the sector should be relatively better for the planet than is the case for other metals critical for Net Zero.
Explore ISS ESG solutions mentioned in this report:
- Identify ESG risks and seize investment opportunities with the ISS ESG Corporate Rating.
- Access to global data on country-level ESG performance is a key element both in the management of fixed income portfolios and in understanding risks for equity investors with exposure to emerging markets. Extend your ESG intelligence using the ISS ESG Country Rating and ISS ESG Country Controversy Assessments.
- Assess companies’ adherence to international norms on human rights, labor standards, environmental protection and anti-corruption using ISS ESG Norm-Based Research.
By: Nicolaj Sebrell, CFA, Head of Energy, Materials, & Utilities, ISS ESG
Arthur Kearney, Analyst, Metals & Mining, ISS ESG
Filip Veintimilla Ivanov, Analyst, Metals & Mining, ISS ESG
