Introduction
The last few weeks have seen a series of events that have created turmoil in the banking sector, an increase in market volatility, and heightened investor anxiety. The collapse of Signature Bank of New York (SBNY) and Silicon Valley Bank (SVB), followed by the fallout of Credit Suisse Group (CSGN SW), have put the spotlight on Financial Materiality and highlighted the importance of a comprehensive assessment through the ESG lens. EVA analysis (Figure 6) shows that, unlike the failures at Signature Bank and Silicon Valley Bank, the collapse at Credit Suisse came after 10 years of poor management.
The stress within the industry and the recent, surprising regularity of banks failing have resulted from a combination of rapid interest rate hikes in Europe and the U.S. and the market taking an aggressive mentality when it comes to weak banks.
Depositors currently seem relatively safe, as central banks and regulators have stepped in to support these stakeholders and avoid further catastrophe. The same cannot be said for shareholders and bond holders, however.
A Bank’s Business Model
Banks take deposits and lend them out or invest them, meaning the deposit is not regularly available. The sharp rise in interest rates has driven down the value of many banks’ holdings. This declining asset value, combined with large withdrawals, has forced some banks to recognize sizeable losses, which exacerbates the problem, leading to more forced selling of underperforming assets to cover more withdrawals. Further, social media and connectivity has meant that bank runs can manifest much quicker: compare the case of SVB versus that of Northern Rock at the height of the 2008 financial crisis.
With Rising Rates, Banks Are a Special Case
At ISS ESG, the Economic Value Added (EVA) framework is used to measure, analyze, and value corporate performance. EVA converts accounting profit into economic profit by reversing accounting distortions and measuring a company’s dollar value profit after all costs, including the cost of giving shareholders a fair return on invested capital, have been considered.
Rising rates will drive up the cost of capital and will therefore reduce most companies’ current profitability (EVA) as well as lead to a higher discount rate on future earnings (Market Value = Capital + Present Value of Future EVA).
Banks are a special case, though. Traditionally when rates increase, banks have a built-in counterbalance to a rising Cost of Capital, as a higher interest rate flows more directly to operating profits (higher interest rate = higher net interest income, all things being equal).
Rising Rates
Rising rates in 2022 had not pushed profitability (EVA Margin) higher, as one might expect for a sector where higher interest rates should flow directly to higher operating profits. Instead, many of the large financial institutions have been reporting that the higher net interest income was merely offsetting declining profits in other areas of their businesses.
Figure 1 highlights the previous correlations with profitability (EVA Margin, red line) and the Fed Funds rate (orange line). From 2004 to 2007, both rose in tandem and then again during the rate hike cycle from 2016 to 2018. However, the rate increases starting in early 2022 have coincided with a decline in EVA Margin and plunging EVA Momentum. Negative EVA Momentum indicates the industry is generating incrementally less profit than it did in the previous period.
Figure 1: Aggregate Profitability and Growth, Global Banks & Capital Markets (Market Cap $10B+)
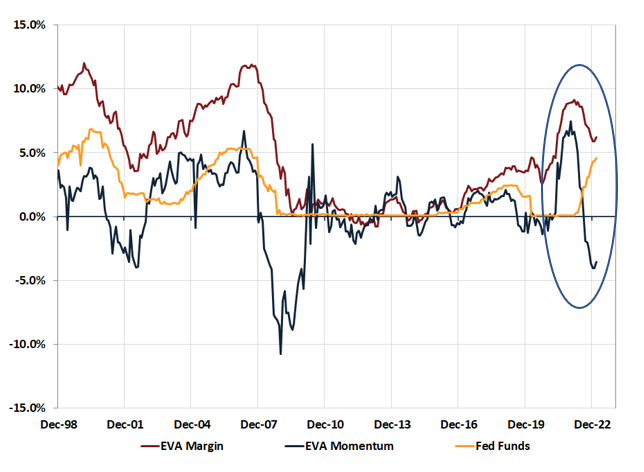
Note: EVA Margin and EVA Momentum graphs are based on trailing-four-quarter results. Fed Funds data is from Factset, using the identifier ‘REFFFUNDEFF-FDS’
Source: ISS EVA and Factset
Capital Ratio Financial Earning Assets
The EVA Capital Ratio Financial Earning Assets (FEA) measure (Figure 2) is similar to a standard Tier 1 Leverage Ratio (Financial Earning Assets divided by Capital).
Figure 2: Capital Ratio Financial Earning Assets, Global Banks & Capital Markets (Market Cap $10B+)
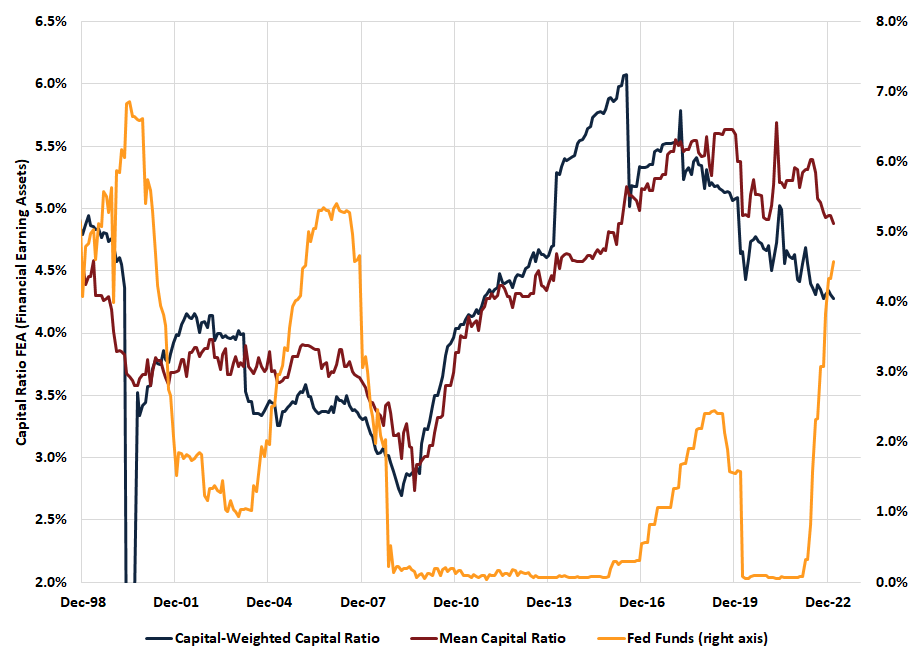
Source: ISS EVA and Factset
After the financial crisis in 2008-2010, the industry had been steadily increasing its Capital Ratio FEA until about 2018, when the larger Banks/Capital Market players began to loosen Capital ratios (the Capital-Weighted aggregate comes down much quicker than the standard mean).
ISS EVA’s PRVit model incorporates the Capital Ratio FEA metric into a Vulnerability Risk factor (R2). This factor also includes metrics for free cash flow generation and operating cash generation scaled to capital. All three of the headline-grabbing bank failures have had above-average EVA Vulnerability Risk factor scores (higher score = higher risk).
Key ESG Considerations
Within the ISS ESG Corporate Rating, the Financials sector identifies five Key Issue Performance items for the Banks and Capital Markets industries:
- Business Ethics Rating is based on an assessment of performance across key social sustainability metrics, including the rated entity’s code of business ethics, compliance procedures, and controversies relating to business ethics. The rating is graded on a twelve-point scale from A+ (excellent performance) to D- (poor performance).
- Labour Standards & Working Conditions covers mental health management, workplace flexibility and working time reduction, and dependent care and special leave.
- Sustainable Investment Criteria looks at environmental and social guidelines for mainstream asset management services, engagement/shareholder advocacy activities, and socially responsible investment products and services.
- Customer & Product Responsibility is based on assessments of performance across key social sustainability issues, which include responsible marketing, sales practices, and treatment of clients with debt repayment problems.
- Sustainability Impacts of Lending & Other Financial Services/Products considers environmental impacts of the product portfolio, application procedures of environmental and social guidelines and transparency, and social impacts of the product portfolio.
All these key factors and other lower-weighted factors go into computing the ESG Performance Score. Scored from 0 to 100, the ESG Performance Score is comparable over all rated entities. Prime Status is based on the ESG rating and a sector-specific Prime threshold. All rated entities with values greater than or equal to 50 are considered ‘Prime’; they score well across Environmental, Social, and Governance metrics.
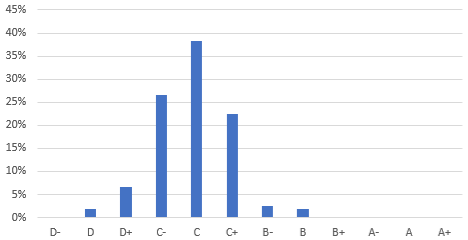
Looking at the spread of ESG ratings (Figure 3) for the universe of Banks and Capital Market firms with a market capitalisation over $10 billion shows the highest distribution around the D+ grade, which is rated poor.
Figure 3: ESG Ratings for Banks Capital Markets (Market Cap $10B+), Distribution by Score
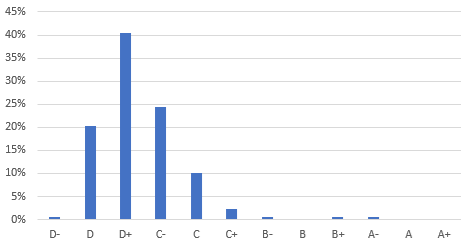
Source: ISS ESG
ESGF: Combining Financial Materiality and ESG
The ISS ESGF Rating helps provide additional insight into a companies’ financial quality, as viewed through the EVA lens alongside the company’s assessed ESG performance. ESGF thereby serves as a data point that helps determine which companies have both strong levels of risk-adjusted profitability as well as positive ESG profiles.
The ESGF model is structured to make sure that poor ESG performance cannot be overly compensated by good financial performance. This is achieved by using a weight distribution of 2:1 between ESG and F. Concretely, companies with poor ESG performance (D ratings) cannot obtain a good or very good ESGF performance rating (A or B rating).
The Banks and Capital Markets data (Figure 4) show that no industry players have a score of B+ or better. Overall, the industry skews towards a Prime rating when factoring in financial performance.
Figure 4: ESGF Ratings for Banks and Capital Markets (Market Cap $10B+), Distribution by Score
Source: ISS ESG
Credit Suisse Case Study
Unlike the failures at Signature Bank of New York and Silicon Valley Bank, the collapse at Credit Suisse Group (CS) came after 10 years of poor management. The ISS ESG Corporate Rating for Credit Suisse is below Prime. CS received a C- in Business Ethics, which includes measures for corruption and money laundering. CS received a D for Customer and Product Responsibility, including a D- for ‘responsible sales practices’ (which falls under the Customer and Product Responsibility Key Issue Performance factor). Figure 5 shows how Credit Suisse scored versus the ISS ESG Corporate Rating Financials sector across all five of the Key Issue Performance factors.
Figure 5: Key Issue Performance for Credit Suisse Group
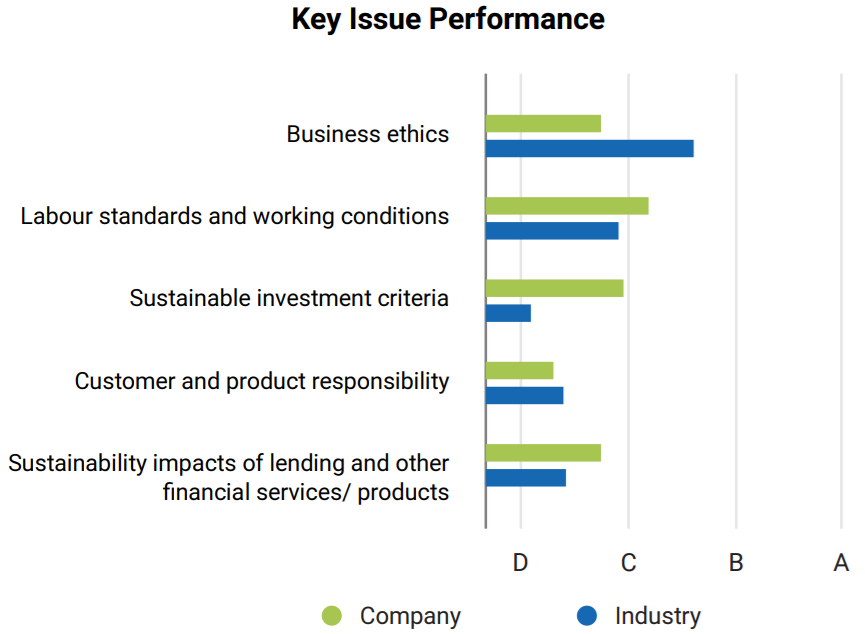
Source: ISS ESG
The financial assessment of Credit Suisse is even more negative than its ESG standing. Over the last 50 quarters, Credit Suisse has had a negative EVA Margin (on a trailing-four-quarter basis) for 26 quarters (red line in Figure 6). Scandals, fines, and large losses from poor risk management have all led to Credit Suisse achieving a very low Profitability score (2) versus the global ISS EVA Financials Services industry group average of 48; Profitability score is ranked 0 to 100 based on EVA Margin and EVA Momentum.
Figure 6: Credit Suisse EVA Fundamentals
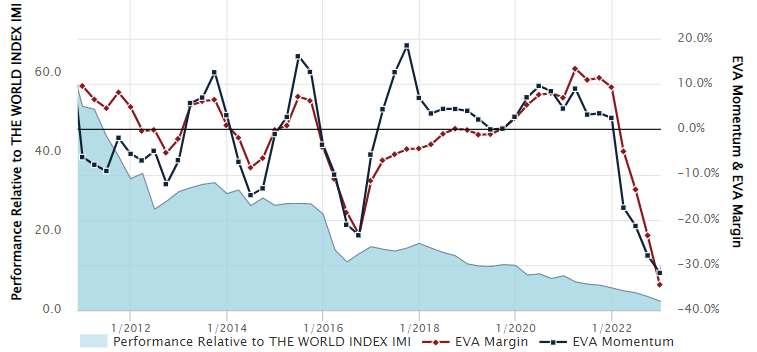
Source: ISS EVA
Besides the poor profitability, the Risk score for the bank moved significantly higher in March 2022, and in August reached the highest possible Risk score (100), including a Vulnerability score (R2) of 99, as cash flow generation has been low and Capital Ratio FEA is low (leverage is high). The PRVit rating in the EVA Framework has been unfavorable since March 2022.
Conclusion
A key consideration for investors in assessing the Financial Quality of a bank is looking at the EVA Vulnerability (R2) measure. The Capital Ratio FEA metric, combined with free cash flow generation and operating cash generation scaled to capital, gives a comprehensive view of a bank’s Financial Risk. ESG data points covering business ethics, customer and client responsibility, and systematic integration of social and environmental aspects can have a material impact on financial performance.
With the likelihood of the recent banking turmoil putting further pressure on economic growth, it will be even more important to understand an investee company’s risks and opportunities through the EVA and ESG lens. ISS EVA and the ISS ESG Corporate Rating can help support investors in these efforts.
Explore ISS ESG solutions mentioned in this report:
- Understand the F in ESGF using the ISS EVA solution.
- Identify ESG risks and seize investment opportunities with the ISS ESG Corporate Rating.
Authored by:
Casey Lea, Global Director of Quantitative Research, ISS EVA/ESG
Gavin Thomson, Global Director of Fundamental Research, ISS EVA/ESG
Rudy Kwack, CFA, ESG Ratings Analyst, ISS ESG