Introduction
With the continued evolution of ESG, traditional Governance can sometimes be overlooked compared to Environmental and Social factors. This paper highlights the importance of understanding financial materiality and governance quality at investee companies and when making a new investment.
The analysis examines firms across the G7 countries by combining ISS Economic Value Added (EVA) data and the ISS Governance QualityScore (GQS) to identify financial materiality and governance quality. The first step is to make an assessment at the sector level before moving on to focus specifically on the Information Technology sector, which has the highest EVA Margin (profitability) and strong Governance Quality.
At the Information Technology sector level, the analysis looks at EVA Margin Variability as a Risk factor and at GQS performance. EVA deducts the “cost” of giving shareholders a minimum acceptable return for their investment. When EVA Margin is above zero, the firm returns above its cost of capital and creates an economic profit. GQS is a decile-ranking score from 1 to 10, where the 1st decile represents relatively better quality and relatively lower governance risk. Classifications are split among Board Structure, Compensation, Audit & Risk Oversight, and Shareholder Rights.
G7 Sector Rankings
From a top-down perspective, the analysis starts by looking at each of the G7 sectors (Figure 1) through the PRVit lens and using the GQS Decile Ranking. The Utilities sector has the most favorable GQS score but looks unattractive from an EVA perspective, with low Profitability, high Risk, and a Valuation score that is not offsetting the low-assessed financial Quality.
Figure 1: G7 Sector Scores (Sorted by Most Favorable GQS Ranking)

Note: PRVit is a 24-factor quantitative stock selection model based on EVA-centric measures of Profitability (P), Risk (R), and Valuation (V). PRVit compares a company’s operational Quality (P-R), based on EVA metrics, to the company’s market-based Valuation. When Quality exceeds Valuation, the overall PRVit ranking will be higher. The model is Value agnostic, where low-Quality, cheap companies and high-Quality, expensive companies can both score as attractive in the PRVit framework.
Source: ISS EVA/ISS GQS (ISS GQS G7 coverage of 3,456 stocks).
The Consumer Staples sector is the most attractive in the PRVit framework, with above-average Profitability, lower-than-average Risk, and cheaper-than-average Valuation. The sector is the second-most favorable from a GQS perspective.
The Information Technology sector has the highest Profitability score, which has driven the second-highest level of financial Quality (P-R). The sector has strong Governance Quality but also has a significant Valuation premium (highly valued) attached.
The Information Technology Sector
Equity market performance has been driven by the Information Technology sector over the past 18 months. This same time period saw a bottoming and improvement in EVA Momentum (incremental change in economic profitability), leading to the sector posting an EVA Margin of 4.3%, the highest at the global sector level. The next step is to examine the correlation between EVA Margin and GQS for the sector.
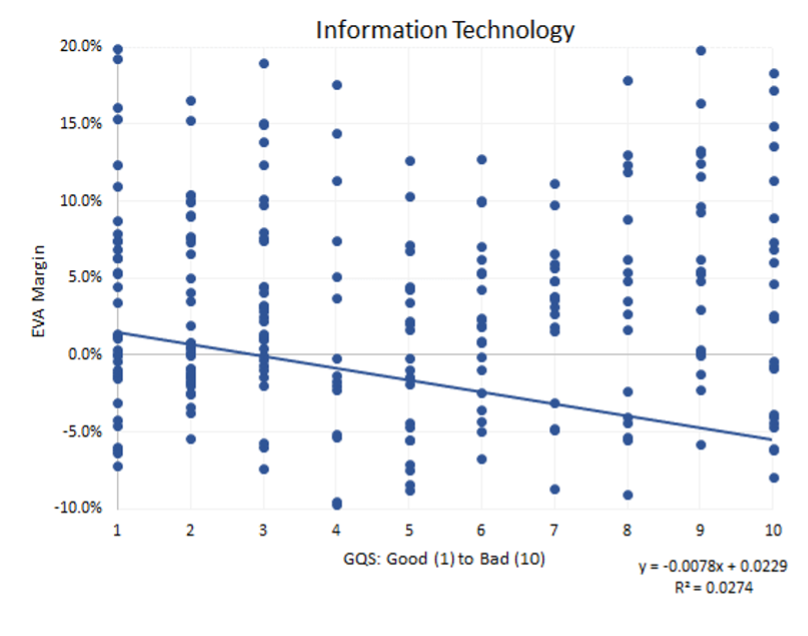
Figure 2 shows that Technology firms with a superior assessed Governance Quality tend to have a higher EVA Margin as well. This is significant because EVA Margin is the true economic profit margin. It is the single best measure of a company’s profit margin because it correctly and completely consolidates pricing power, operational efficiency, and the quality of asset management.
Figure 2: Information Technology Sector EVA Margin and GQS
Source: ISS EVA/ISS GQS
When EVA Margin is combined with the Governance QualityScore, investors gain insight into how strong and effective a board is in its decision making. Such insight helps tell an even more comprehensive story for an investment.
Key Governance Factors for the Information Technology Sector
GQS’ four main categories are Board Structure (“Board”), Compensation (“Comp”), Audit & Risk Oversight (“Audit”), and Shareholder Rights (“ShR”). Figure 3 below breaks down the average scores of each category by sector. Such information helps in the nuanced assessment and indicates both areas for improvement and those of relatively stronger performance. The Information Technology sector in general demonstrates better scores in the Audit and Risk Oversight category.
Figure 3: Information Technology Sector GQS Performance by Governance Category
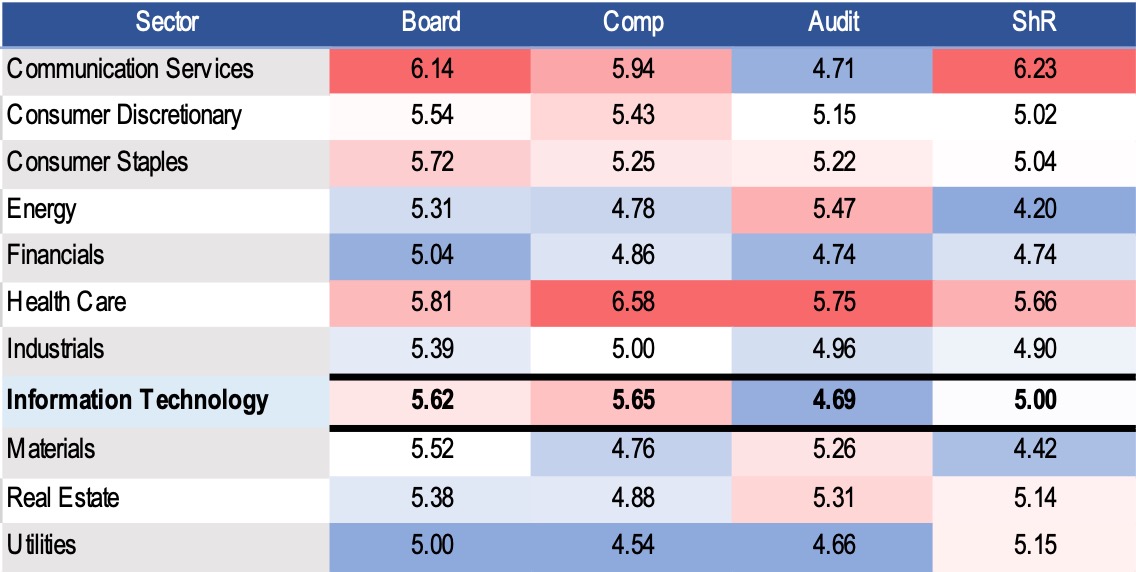
Note: A lower GQS Performance score is better.
Source: ISS GQS
Information Technology at the Industry Level
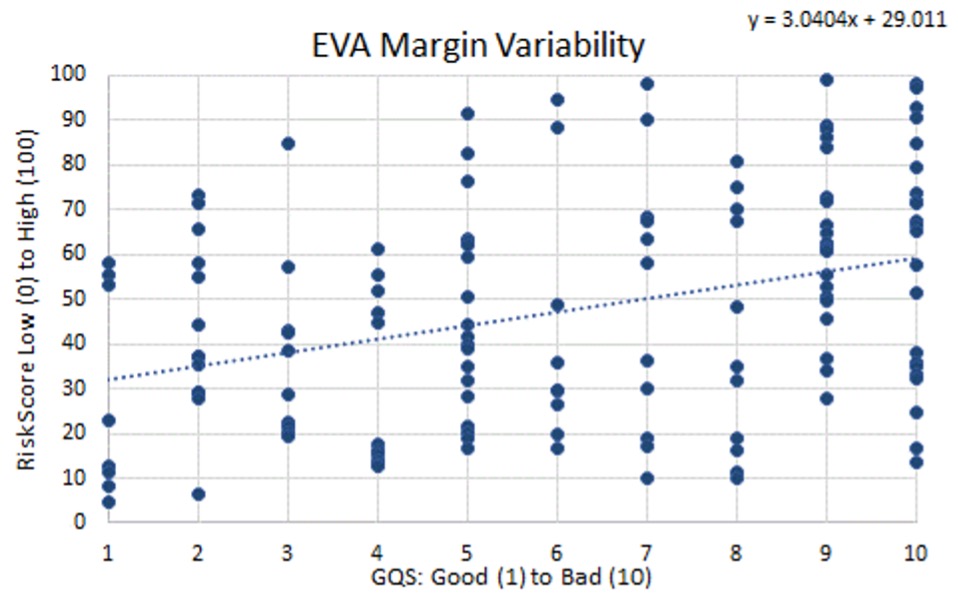
At the industry level, the Software, Electrical Equipment, IT Services, and Semiconductor industries have a positive correlation between lower EVA Margin Variability (higher consistency of economic profitability over time) and a favorable Governance QualityScore. Only the Communications Equipment industry has an inverse relationship. This industry tends to have lower-than-sector-average financial Quality (Risk-Adjusted Profitability) as well.
EVA Margin Variability looks at the ranking of the standard deviation of the last 12 quarters of EVA Margin. EVA Margin Variability is a factor that represents the sustainability and strength of the business model. Low Variability also means the business is inherently less cyclical, and a less volatile business should be aligned with the interests of long-term investors and stakeholders. Assessing the consistency in economic profitability by measuring EVA Margin Variability is consistent with assessing the Governance Quality, which should aim to reflect stronger decision-making on the long-term outlook of the business and representation for minority shareholders.
Focus on the Software Industry
Figure 4 shows EVA Margin Variability and GQS for the Software industry. There is a stronger correlation for the large cap Software firms that have a good Governance profile and low EVA Margin Variability.
Figure 4: Software Industry EVA Margin Variability and GQS
Source: ISS EVA/ISS GQS; 135 companies in the Software industry with GQS Coverage
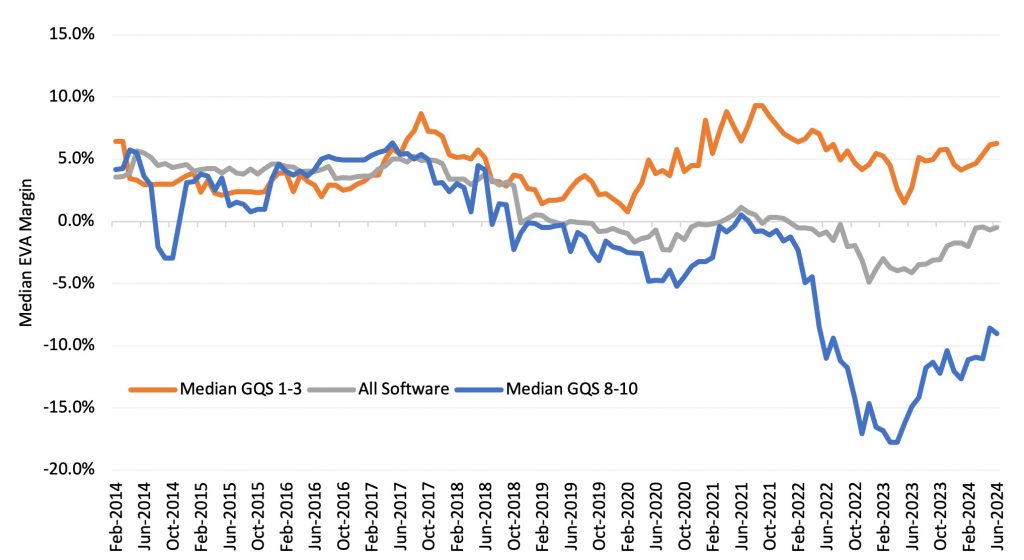
The absolute EVA Margin level is also high, with an average of 13.3% for firms with a GQS Decile Rank of 1 and 8.1% for firms with a GQS Decile Rank of 2. This compares with an average EVA Margin of -12.8% for firms with the worst GQS of 10. In Figure 5, firms with a median GQS of 1-3 (most favorable) and firms with a median score of 8-10 (least favorable) are grouped together. The former group has a high combined average EVA Margin of 6.3% versus the latter group, which has a negative EVA Margin of -9%. The Software aggregate median EVA Margin is -0.5%.
Figure 5: Software Industry EVA Margin and GQS
Source: ISS EVA/ISS GQS; 135 companies in the Software industry with GQS Coverage
IT Services and Software Services rank very high in Governance QualityScore overall, while Semiconductors & Semiconductor Equipment are at the lower end. At the factor level, the analysis compared Software against 72 other industries.
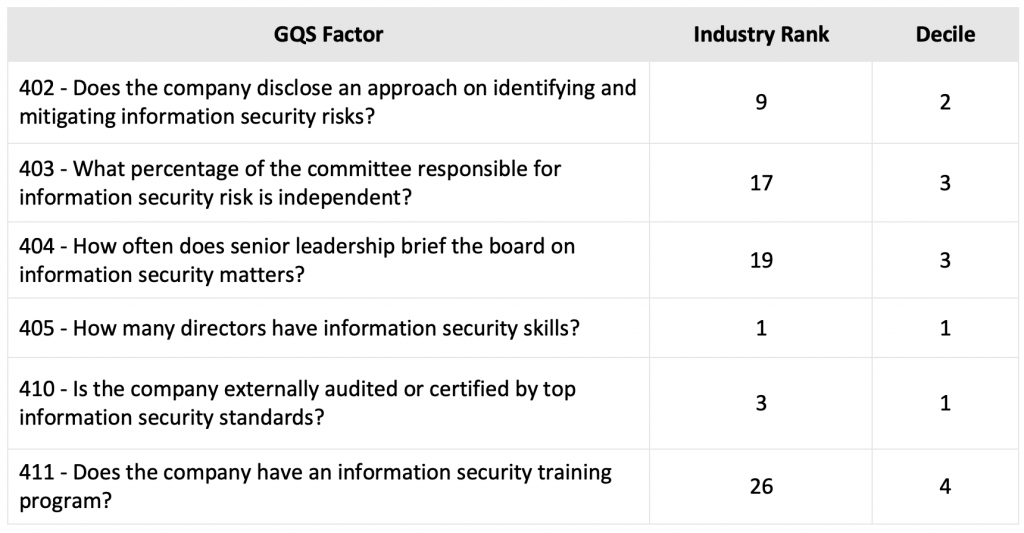
Looking at the Software industry more specifically shows a consistent pattern around the GQS factors related to their disclosed approach to information security policies and practices, as illustrated in Figure 6. Software industry companies tend to be among the top deciles and industry rankings for such GQS factors. These results confirm the hypothesis that Software companies tend to seriously consider this specific governance aspect lying at the core of their economic model.
Figure 6: Software Industry Select GQS Factor Performance on Information Security
Source: ISS GQS
Conclusion
This analysis has shown the importance of understanding financial materiality and governance quality by combining ISS EVA and ISS GQS. There is a demonstrated linkage for the Information Technology sector showing that strong assessed Governance is consistent with a high level of economic profitability. In examining how consistent the level of wealth creation or economic profitability is over time, the paper illustrates that lower EVA Margin Variability is also consistent with a favorable GQS Decile Rank.
Explore ISS ESG solutions mentioned in this report:
- Understand the F in ESGF using the ISS EVA solution.
- ISS ESG’s Governance QualityScore supports investors as they consider governance in their quality analyses and incorporate unique compensation, board, and shareholder responsiveness data into management assessments.
By:
Casey Lea, Global Director of Quantitative Research, ISS ESG/ISS EVA
Gavin Thomson, Global Director of Fundamental Research, ISS ESG/ISS EVA
Guillaume Tassin, Head of Data Solutions, ISS ESG Product
Hinza Zeru, Vice President, Governance QualityScore, ISS ESG Product

