KEY TAKEAWAYS
- Understanding portfolio exposure to social issues and valuing human capital remain investor priorities.
- Reporting and transparency of relevant intangibles data such as workforce metrics lag environmental disclosures.
- Growing availability of standardized EEO-1 U.S. workforce data may enable investors to gain portfolio insights.
Social Data for Investors
According to recent investor surveys from wealth managers and consultants, understanding and analyzing their investment’s exposure to social issues remains a priority. However, corporate reporting standards and transparency of social and human capital data have lagged those of environmental data such as greenhouse gas emissions. For instance, disclosure of a company’s workforce composition has until recently been relatively uncommon and could provide investors with actionable portfolio insights. Comprehensive and standardized workforce data for U.S. workers through the EEO-1 Component Data is collected by the U.S. Equal Employment Opportunity Commission (EEOC). In this article we review the growing extent of EEO-1 disclosure and examine it at an aggregate level, visually illustrating some of its key attributes.
What is EEO-1 Workforce Data?
EEO-1 reporting is a mandatory annual disclosure requiring all private employers with 100 or more employees to submit U.S. workforce composition data, including data by professional job category, gender, and race or ethnicity, to the EEOC in a standardized format. While corporations are not required to make their EEO-1 reports public, an increasing number of them have voluntarily elected to do so.
Given its standardized format, comparability, and broad coverage of all U.S. employees, EEO-1 data may enable investors to evaluate the workforce structure of portfolio companies following a consistent approach. Under ISS ESG’s raw data offering, ISS ESG systematically collects EEO-1 disclosures from public sources (when available) within a potential universe of over 5,000 U.S. issuers. The data are compiled into a standardized format that can be delivered to investors as frequently as daily.
Overall Coverage and Employee Counts
As of May 2024, there were 474 publicly traded U.S. issuers in the ISS ESG EEO-1 dataset that have disclosed complete EEO-1 data since January 2022, covering their workforce composition within the last two years. The data encompass 15.2 million workers in total. Since total U.S. employee count is otherwise not consistently disclosed by corporations, this dataset allows investors to gain some perspective on the relative scale of issuers’ U.S workforce, as shown in Figure 1.
The median number of workers per company is 9,550, with a very wide range spanning from approximately 100 workers to 1.6 million. As the histogram illustrates, there are two U.S. employers with over a million workers as well as a meaningful number with fewer than 1,000 employees.
Figure 1: Number of U.S. Workers – Histogram and Summary Statistics
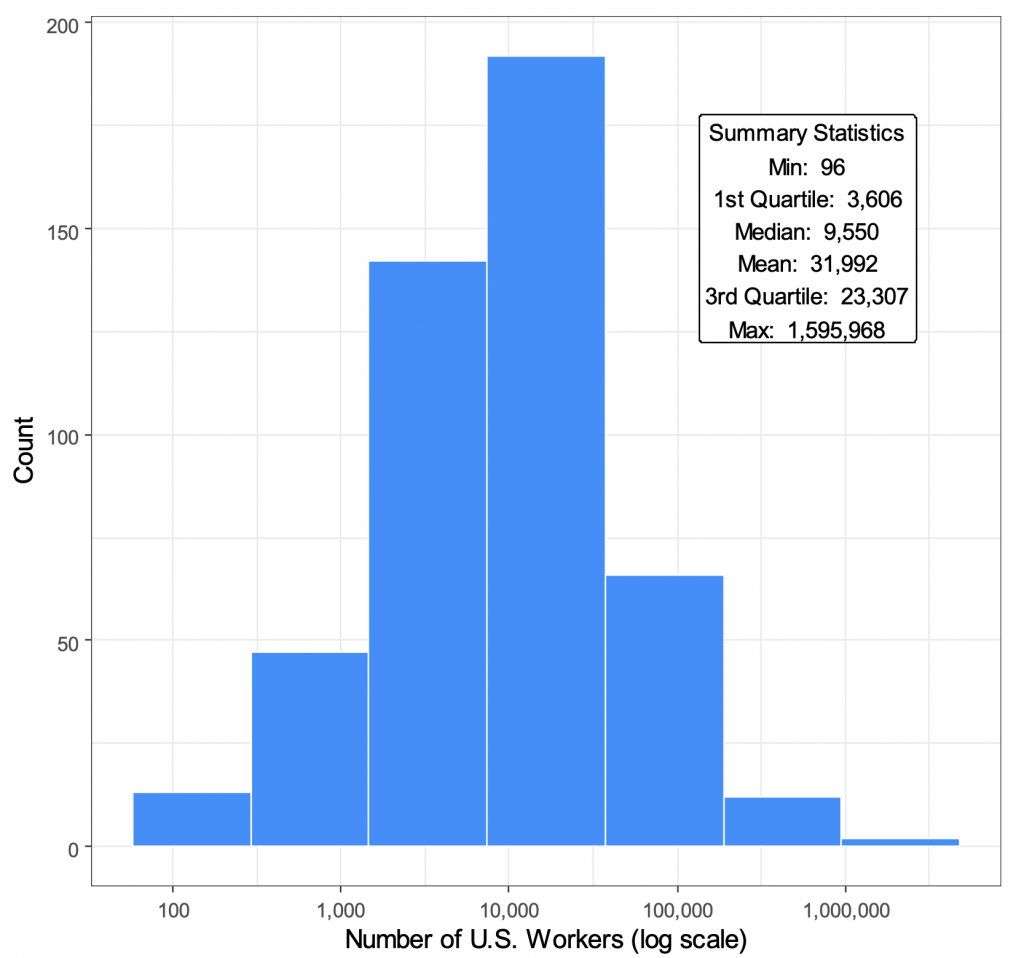
Source: ISS ESG EEO-1 dataset
Analyzing the U.S. Large Cap Equity Universe: STOXX USA 500 Index
To render this analysis as relevant as possible to institutional investors, the next step is to filter the universe to cover only the U.S. large cap space, using the STOXX USA 500 Index of the largest U.S. companies as the definition. Within this universe, 320 companies are disclosing EEO-1 data, amounting to 73% of the total index market cap and now encompassing 13.6 million employees. The median number of employees in this universe rises to approximately 12,900, while the mean is now 42,500.
A Look at EEO-1 Professional Job Classifications
EEO-1 places employees into one of 10 standardized professional job classifications, potentially allowing investors to better understand a company’s operating processes and structure. These categories include, for example, Executive/Senior Level Officials and Managers, First/Mid-Level Officials and Managers, Professionals, Technicians, and Administrative Support Workers, among others (Figure 2).
Figure 2: EEO-1 Professional Classifications
| JOB CATEGORY | EXAMPLE OCCUPATIONS |
| Executive/Senior Level Officials and Managers | chief executive officers; chief operating officers; chief financial officers; line of business heads; presidents or executive vice presidents of functional areas or operating groups |
| First/Mid-Level Officials and Managers | vice presidents and directors; group, regional, or divisional controllers; treasurers; human resources, information systems, marketing, and operations managers |
| Professionals | accountants and auditors; airplane pilots and flight engineers; architects; artists; chemists; computer programmers |
| Technicians | drafters; emergency medical technicians; chemical technicians; and broadcast and sound engineering technicians |
| Sales Workers | advertising sales agents; insurance sales agents; real estate brokers and sales agents; wholesale sales representatives; securities, commodities, and financial services sales agents |
| Administrative Support Workers | office and administrative support workers; bookkeepers; accounting and auditing clerks; cargo and freight agents; dispatchers |
| Craft Workers | boilermakers; brick and stone masons; carpenters; electricians; painters (both construction and maintenance) |
| Operatives | textile machine workers; laundry and dry-cleaning workers; photographic process workers; weaving machine operators; electrical and electronic equipment assemblers |
| Laborers and Helpers | production and construction worker helpers; vehicle and equipment cleaners; laborers; freight, stock, and material movers; service station attendants |
| Service Workers | cooks, bartenders, and other food service workers; medical assistants and other healthcare support positions; hairdressers; ushers |
Source: EEOC
In aggregate, Sales Workers represent the largest job category, at 24% of workers, followed by Professionals at 21%. Combined, they account for 45% of covered employees in the STOXX USA 500. Beyond that, next in the top-5 list are First/Mid-level Officials and Managers, Laborers and Helpers, and Administrative Support Workers. As shown on Figure 3 below, the top 5 categories account for about 75% of employment, while Executive/Senior Level Officials and Managers are less than 1% of total workers.
Figure 3: STOXX USA 500 Employees by EEO-1 Professional Classification
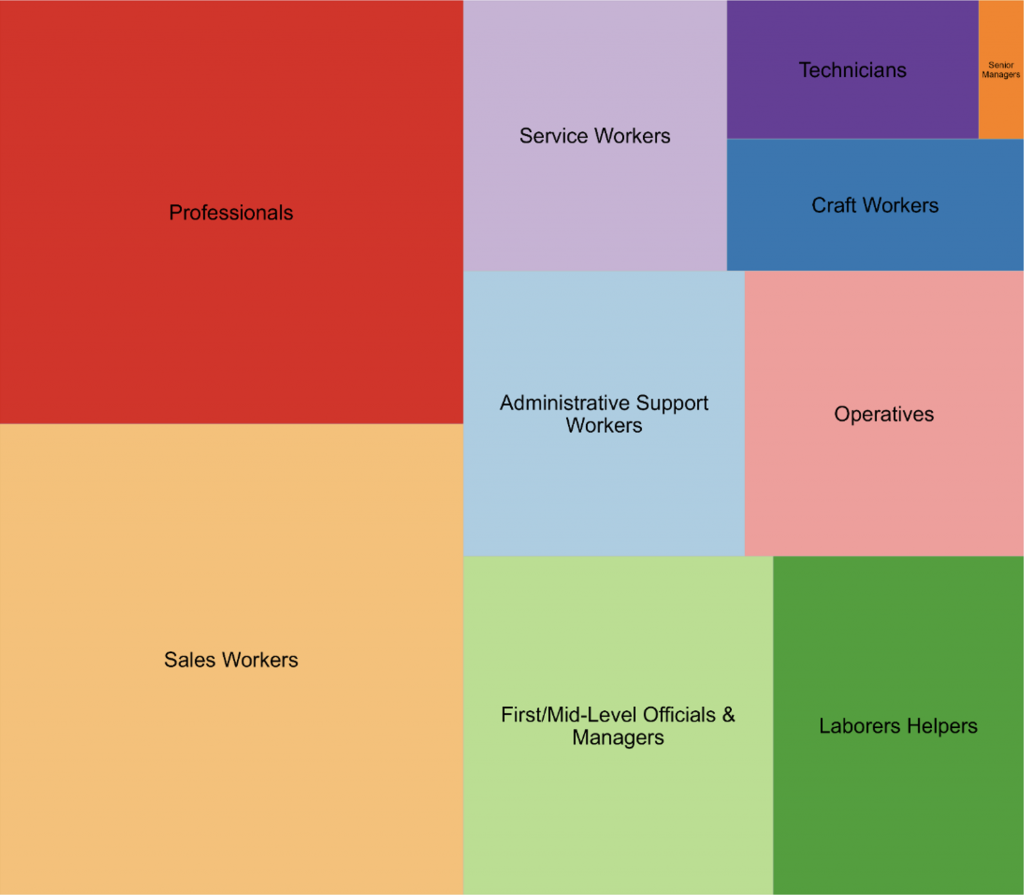
Source: ISS ESG EEO-1 dataset
Employee Gender and Ethnicity
Examining the underlying EEO-1 categories in the STOXX USA 500 universe reveals a total of 7.4 million male workers and 6.2 million female workers, representing 55% and 45% of employees, respectively (Figure 4).
Figure 4: STOXX USA 500 Employees by Gender
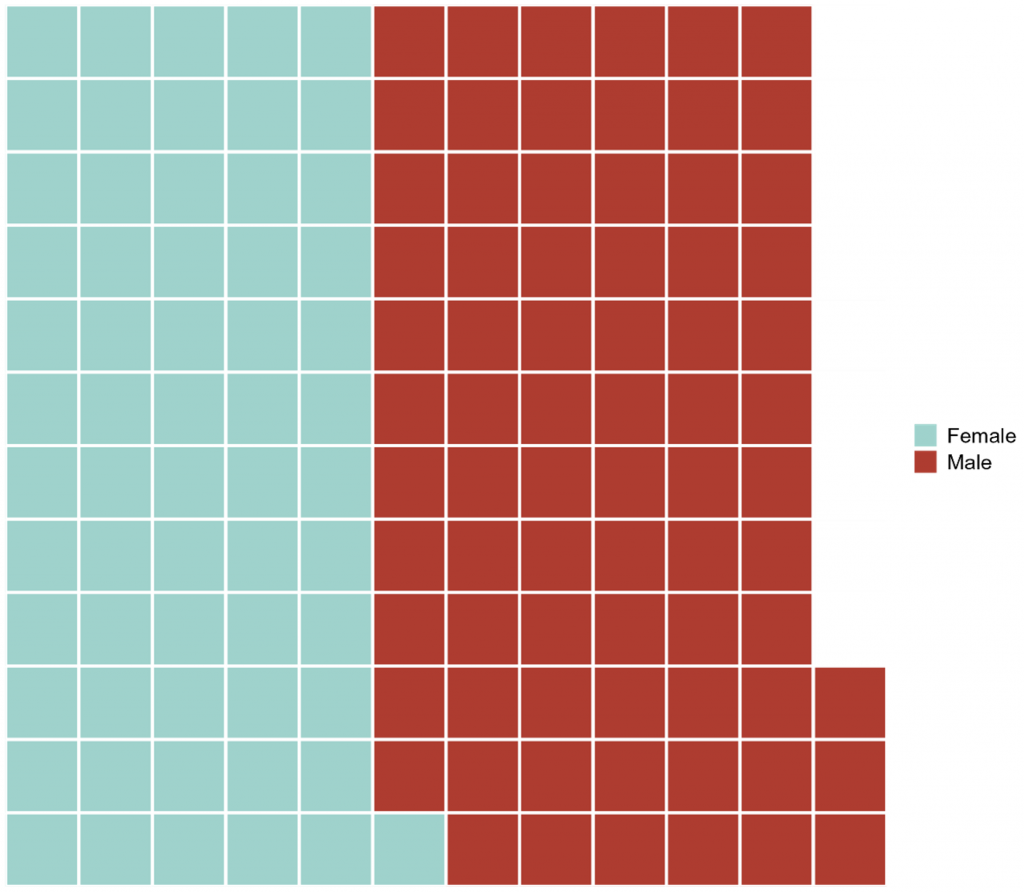
Source: ISS ESG EEO-1 dataset. Each square represents 100,000 employees.
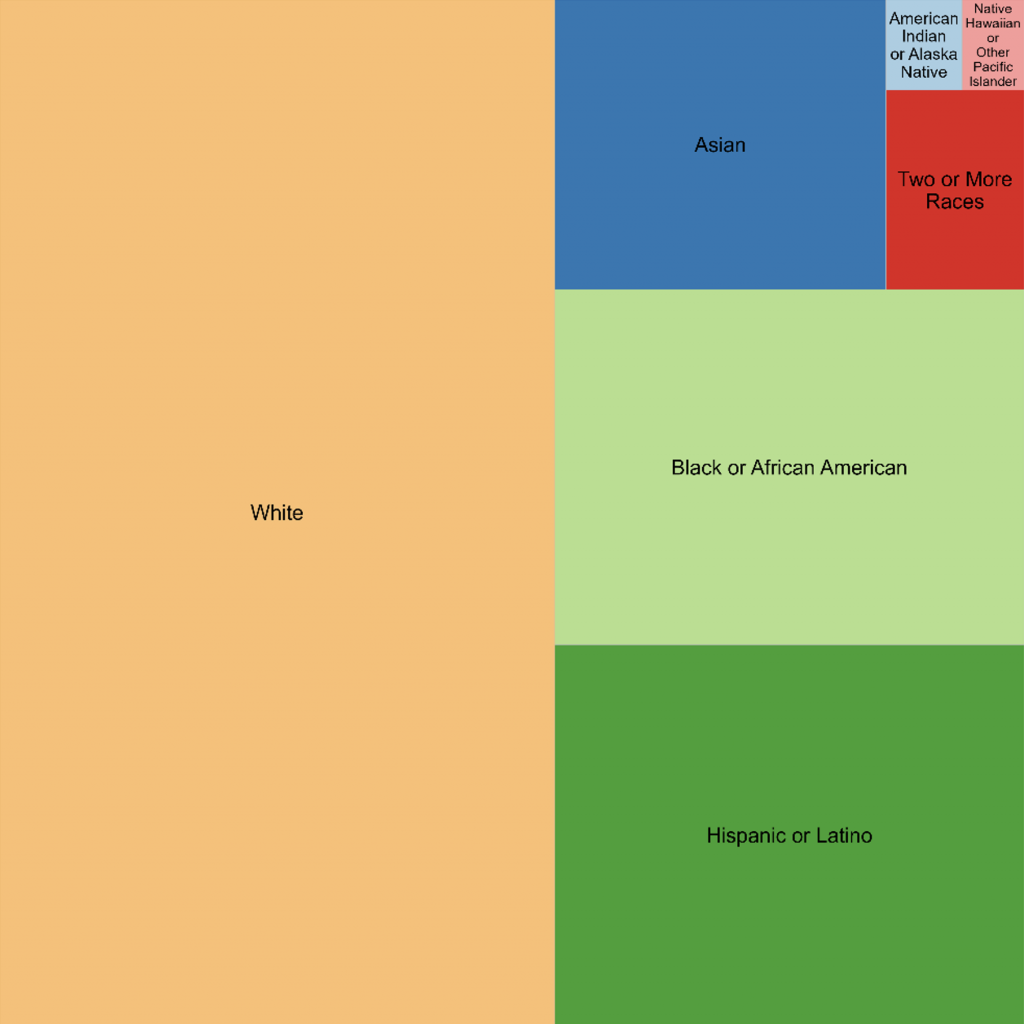
Regarding race or ethnicity, EEO-1 data provide seven distinct categories following U.S. government definitions, which also include “two or more races.” As shown in Figure 5, Hispanic or Latino and Black or African American are the two largest minority groups, at 17% and 16% of workers, respectively, followed by Asian at 9%.
Figure 5: STOXX USA 500 Employees by Race or Ethnicity
Source: ISS ESG EEO-1 dataset
To highlight the granularity that EEO-1 data provide, Figures 6 and 7 show the racial/ethnic groupings by professional job classification, in terms of both number and percent of workers. If desired, the data could be further broken out by gender.
Figure 6: Racial/Ethnic Composition of STOXX USA 500: Number of Employees by Professional Classification
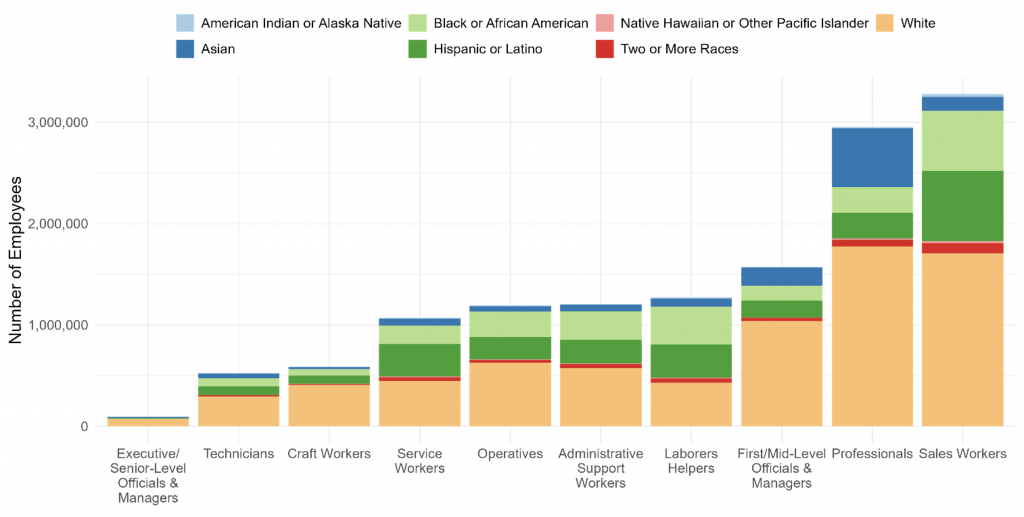
Source: ISS ESG EEO-1 dataset
Figure 7: Racial/Ethnic Composition of STOXX USA 500: Percent of Employees by Professional Classification
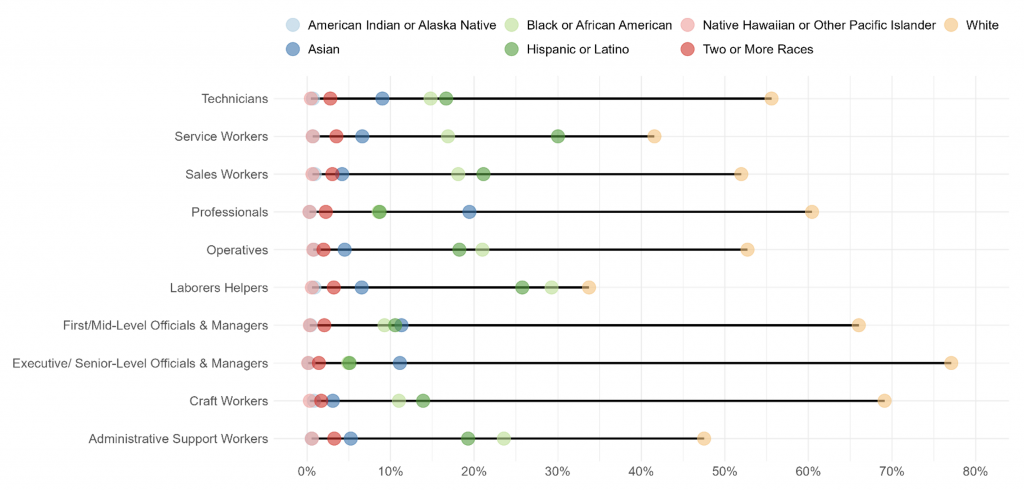
Source: ISS ESG EEO-1 dataset
Industry Structure Analysis Using the Simpson Index
The Simpson index (λ, known as the Herfindahl–Hirschman index in economics) is a frequently used measure that quantifies dispersion or concentration within a market or population. It is calculated as the sum of the squares of the percentage shares of each category analyzed, with higher values indicating greater concentration. Investors may be interested in the extent to which professional or ethnicity categories across industries or companies may be more concentrated or dispersed.
Figure 8 plots the Inverse Simpson Index (1 / λ) for ethnicity by ICB industry for the STOXX USA 500 universe. Higher values of this metric indicate lower concentration, and the value can be interpreted as the “effective” number of parties. The chart indicates that, based on the median companies, the Consumer Discretionary and Telecommunications industries have the highest dispersion, while Utilities and Basic Materials have the lowest. As indicated by each dot which represents a company, there is also very significant dispersion within each industry.
Figure 8: STOXX USA 500 Inverse Simpson Index for Ethnicity by Industry
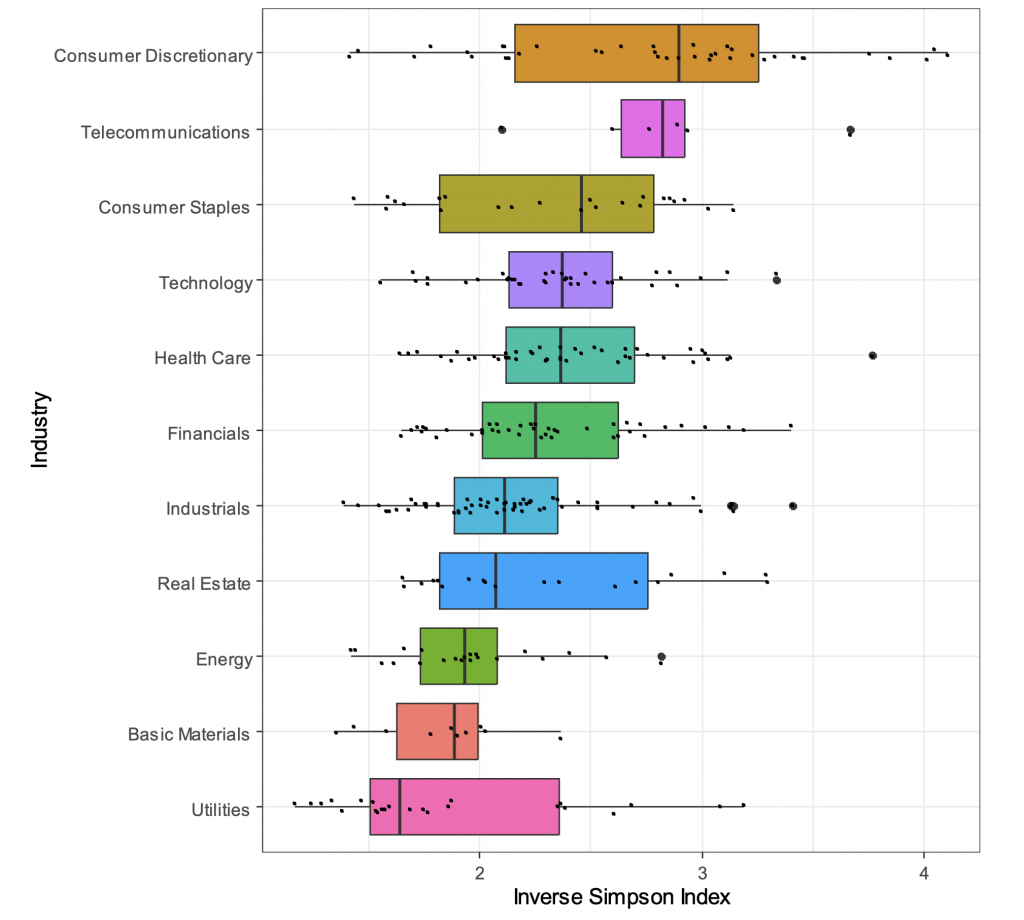
Source: ISS ESG EEO-1 dataset
Summary: A Step toward a Better Understanding of Intangibles
According to market metrics, intangible assets, including human capital, may represent the majority of the market value of U.S. equities. However, disclosure of relevant data such as workforce structure remains relatively rare, potentially resulting in a significant investment blind spot. Due to its comprehensive and regulatory standing, as well as growing voluntary disclosure, EEO-1 data may provide investors with a broad picture of a company’s U.S. workforce across professional functions, gender, and race and ethnicity. ISS ESG’s raw data offering compiles the complete granular historical EEO-1 disclosures for U.S. issuers, a potentially valuable tool for portfolio construction or corporate engagement.
Explore ISS ESG solutions mentioned in this report:
- ISS ESG’s Governance QualityScore supports investors as they consider governance in their quality analyses and incorporate unique compensation, board, and shareholder responsiveness data into management assessments.
By:
Hernando Cortina, CFA, Managing Director, ISS ESG
Moe Phyu, Associate, ISS ESG