Below is an excerpt from ISS ESG’s thought leadership paper: Implications of Index Reconstitutions: Free Carbon Alpha?. The full paper is available for download from the Institutional Shareholder Services (ISS) online library.
KEY TAKEAWAYS
- ISS ESG’s Climate Impact Report provides a detailed analysis of a portfolio’s carbon footprint, with 99.85% of coverage of the Russell 3000 Index. In preparing this report, the authors analysed the climate profile of $100 billion invested in a portfolio based on the Q1 Russell 3000 Index against the rebalanced benchmark in Q2.
- According to the climate analysis, the rebalanced Russell 3000 exceeds its Sustainable Development Scenario (SDS) emissions budget by approximately 8% in 2022 and will exceed it by more than 400% by 2050 due to higher exposure to conventional sources of electricity than the SDS scenario.
- The weighted average carbon intensity of the Russell 3000 increased by 9.4% after the June 2022 rebalancing, jumping from more than 140 tCO2e/$mn of revenue in 1Q22 to more than 153 tCO2e/$mn.
- If a business is to grow at the same time as staying within Paris-aligned carbon emission budgets, its carbon intensity must be reduced. The challenge for investors is to identify the most efficient players that can operate successfully in the face of the necessary emission reductions.
- The Climate Impact Report and other ISS ESG Climate Solutions can assist investors in developing strategies to achieve lower future portfolio emissions, as well as providing the tools to promote real-world outcomes through active stewardship of their investments.
To support investment decisions, ISS ESG’s Climate Impact Report includes a detailed analysis of a portfolio’s carbon footprint. This analysis covers projected emission pathways under various climate scenarios, as well as forward-looking assessments of climate risks and opportunities. Key metrics covered include Scope 1 & 2 and Scope 3 (tCO₂e) emissions for the portfolio; Relative Carbon Footprint (tCO₂e/$mn invested); and Weighted Average Carbon Intensity (tCO₂e/$mn of revenue). The ISS ESG Climate Impact Report also includes:
- an analysis of the top 10 contributors to a portfolio’s emissions and emissions intensity;
- Net Zero Analysis;
- Transition Risk Analysis; and
- Physical Risk Analysis.
ISS ESG has analyzed the climate profile of $100 billion invested in a portfolio based on the 1Q22 Russell 3000 Index. This result was benchmarked against the post-June 2022 reconstitution index, to understand the key changes to its climate profile.
While 86% of the companies in the portfolio (by market capitalization) directly report their greenhouse gas emissions, this represents only 34% of reporting companies by number. The data for the remaining 14% of the index’s market capitalization was estimated by the ISS ESG climate research team using 800 proprietary sector and sub-sector-specific models developed in collaboration with the Swiss Federal Institute of Technology.
Looking at Scope 1 & 2 emissions and revenue data from ISS ESG’s Climate Research team, the Utilities, Energy, and Materials sectors are estimated to be the most emissions-intense sectors globally.
Figure 1: The Average Scope 1 & 2 Emissions Intensity of Issuers in Different GICS Sectors Globally (tCO₂e/$mn revenue)
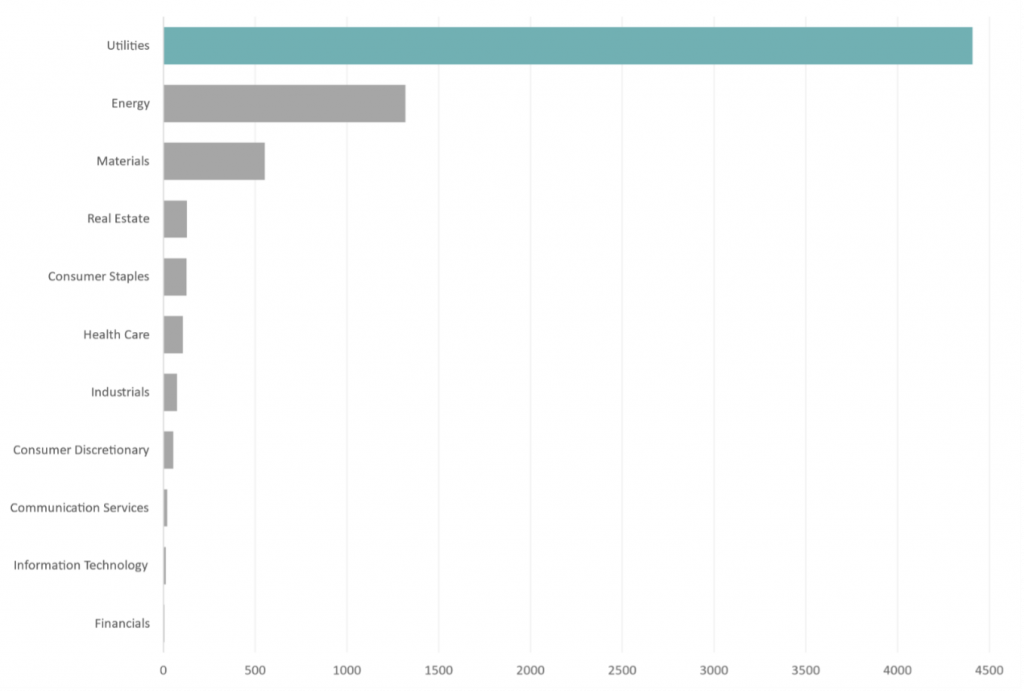
Source: ISS ESG Climate Impact Report
Explore ISS ESG solutions mentioned in this report:
- Use ISS ESG Climate Solutions to help you gain a better understanding of your exposure to climate-related risks and use the insights to safeguard your investment portfolios.
By: Devansh Kumar, ESG Specialist, ISS ESG