KEY TAKEAWAYS
- Japan aims, through its National Biodiversity Strategy 2023-2030, to become nature positive, and specifically to address the need for an integrated approach to both biodiversity loss and climate change. Integrating biodiversity and natural capital perspectives into business activities is seen as crucial to this strategy’s success.
- While many Japanese businesses have pledged to become nature positive, concrete actions are still to follow. A recent survey by Keidanren, the Japan Business Federation, on member companies’ biodiversity efforts found that rarely is the link between climate change and biodiversity conservation established.
- Mapping resources used by companies based on their business activities and geographical location shows that, for Japanese companies, mining of uranium and thorium ores is the activity with the highest share of biodiversity impact.
- A significant portion (88%) of the overall biodiversity impact of Japanese companies is found in the Asia Pacific region, with 37% associated with Japan alone.
- The ISS ESG Biodiversity Impact Assessment Tool (BIAT) offers data on companies’ impacts on biodiversity and their dependencies on ecosystems services. BIAT can support investors as they assess biodiversity considerations in Japan and elsewhere.
An environmental goal that has been receiving increased attention is for human activity to become ‘nature positive.’ To be nature positive is not only to minimize damage to the environment but to ensure “the improvement in the abundance, diversity, integrity and resilience of species, ecosystems and natural processes.”
Transitioning to a nature-positive global socio-economic system could also bring economic benefits: by one estimate, such a transition could generate up to $10.1 trillion in annual business value and create 395 million jobs by 2030.
Japan has been proactive in addressing nature loss by formulating its National Biodiversity Strategy 2023-2030. The strategy aims to become nature positive, specifically addressing the need for an integrated approach to both biodiversity loss and climate change. It is based on five strategies: restore healthy ecosystems, develop nature-based solutions to address societal challenges, recognize and act upon biodiversity in everyday life and consumption, promote international cooperation on biodiversity, and promote a nature positive economy. Thus, integrating biodiversity and natural capital perspectives into business activities is seen as crucial to this strategy’s success.
To achieve the National Biodiversity Strategy’s goals, the Japanese government has established the 30by30 Roadmap. The 30by30 Roadmap aims to conserve or protect at least 30% of land and sea areas by 2030 in line with the Kunming-Montreal Global Biodiversity Framework.
The analysis of Japanese companies conducted here is meant to provide an overview on how companies have an impact on biodiversity and nature, as well as how companies rely on ecosystem services. While many Japanese businesses have pledged to become nature positive, concrete actions are still to follow.
The ISS ESG Biodiversity Impact Assessment Tool (BIAT) offers data on companies’ impacts on biodiversity and their dependencies on ecosystems services. BIAT can support investors as they assess biodiversity considerations in Japan and elsewhere.
Biodiversity Considerations among Japanese Companies
Japanese companies have been at the forefront of adopting the recommendations by the Taskforce on Nature-related Financial Disclosures (TNFD), finalized in September 2023. Approximately 25% of all TNFD early adopter companies globally are Japanese, with Japan being the country with the highest number of early adopters. Similar trends were observed for the adoption of the recommendations of the Task Force on Climate-related Financial Disclosures (TCFD), with a disproportionately large number of Japanese organizations expressing their support for TCFD.
Despite such commitments, progress has been slow. A recent survey conducted by Keidanren, the Japan Business Federation, on member companies’ biodiversity efforts finds that, though overall improvements, mostly related to biodiversity-related commitments and disclosures, have been observed, sufficient progress has not been made, as companies often lack a systematic approach to incorporating biodiversity into business considerations and throughout value chains.
While many Keidanren member companies have committed to the Federation’s goal of realizing a “sustainable society through building a society in harmony with nature,” the survey indicates that few companies had board-level discussions, disclosed relevant policies, or had established relevant quantitative targets and measures regarding biodiversity. One finding highlighted by the survey results is that rarely is the link between climate change and biodiversity conservation established, as set out in the National Biodiversity Strategy.
Biodiversity Impacts of Japanese Companies
Companies can assess their biodiversity impacts through myriad biodiversity metrics. The Potentially Disappeared Fraction of Species (PDF) and the Mean Species Abundance (MSA) are the metrics most commonly used and most commonly referenced in the TNFD guidance document.
The ISS ESG Biodiversity Impact Assessment Tool (BIAT) calculates the PDF and MSA metrics to measure the biodiversity impact of companies. The following analysis explores the largest (by market capitalization) 1,000 listed Japanese companies, the TOPIX 1000, and their impacts and dependencies on biodiversity and nature.
Distribution of Biodiversity Impact
BIAT data notably indicates that TNFD early adopter companies are well represented among companies with a significant impact on biodiversity: over half of these companies have a medium-to-very-high impact on biodiversity. This suggests that early adopters include relevant companies where biodiversity is considered a material topic.
When examining the biodiversity impacts of the TOPIX 1000 Japanese companies, close to 60% fall under the medium, high, or very high impact category (Figure 1). These companies are considered to have a significant impact on biodiversity, based on their revenue-adjusted (intensity) biodiversity impact classification.
Figure 1: Revenue-Adjusted Biodiversity Impact Classification of TOPIX 1000 Companies
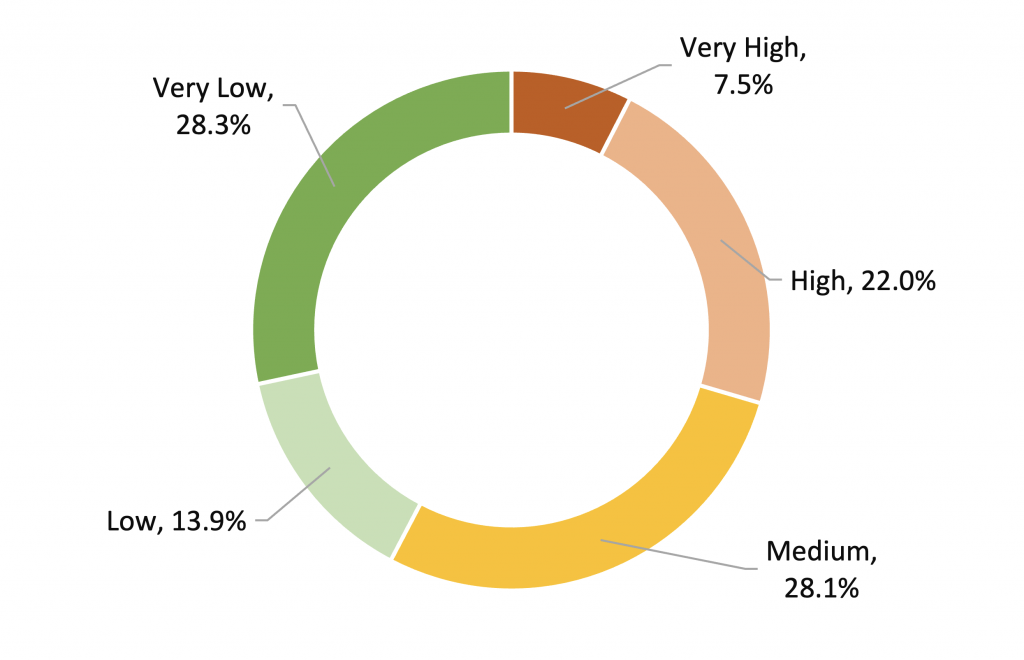
Source: ISS ESG
The Industrials sector is the most prominent sector driving this assessment, given the strong sector representation among Japanese companies (Figure 2). Consumer Staples is observed to have the largest share of companies with a very high impact on biodiversity, followed by Materials.
Figure 2: Revenue-Adjusted Biodiversity Impact Classification of TOPIX 1000 Companies by GICS Sector
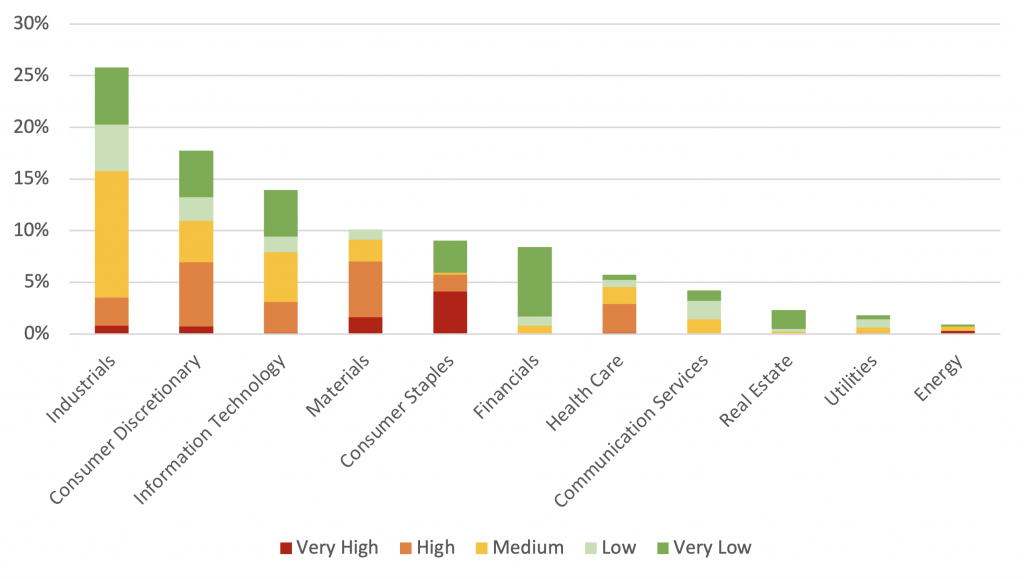
Source: ISS ESG
Within the Industrials, Consumer Staples, and Materials sectors, the three industries with the greatest biodiversity impact are Trading Companies and Distributors, Food Products, and Chemicals. These findings are supported by the ISS ESG SDG Impact Rating, where Japanese companies within these three industries are found to have a negative impact on the two sustainable development goals directly associated with biodiversity and nature, SDG 14 Life below Water and SDG 15 Life on Land.
Drivers of Biodiversity Impact
Analyzing the direct drivers for this assessment, as defined by the Intergovernmental Science-Policy Platform on Biodiversity and Ecosystem Services (IPBES), shows that among the four IPBES categories, as assessed in the BIAT tool, Land Use Change is the strongest driver of biodiversity loss, followed by Climate Change and Pollution.
It is also possible to examine the underlying activities that companies are involved in with an impact on biodiversity. Mapping resources used by companies based on their business activities and geographical location shows that, for Japanese companies, mining of uranium and thorium ores is the activity with the highest share of biodiversity impact. Such activity contributes about 20% of the total impact that Japanese companies have on biodiversity overall (Figure 3).
Figure 3: Top 10 Activities with Biodiversity Impact by TOPIX 1000 Companies
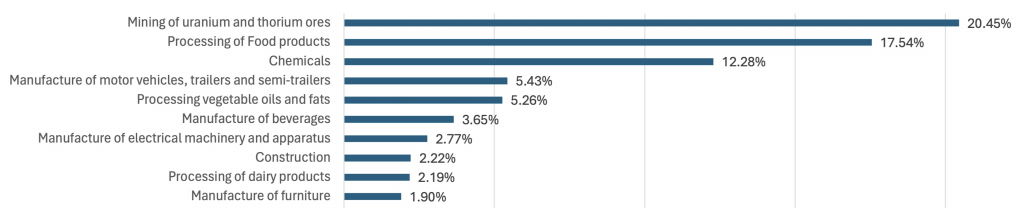
Notes: The dataset covers 116 activities in total; the percentages represent the proportion of total biodiversity impact accounted for by each Top 10 activity. Mining of uranium and thorium ores thus accounts for 20.45% of the total biodiversity impact of all 116 activities.
Source: ISS ESG
The top three activities, i.e., mining of uranium and thorium ores, processing of food products, and chemicals, contribute about 50% of the combined impact of the top 1,000 Japanese companies. The companies most heavily involved in these activities and driving the impact on biodiversity are thus representatives of the Trading Companies and Distributors industry (which is linked to mining) and the Food Products industry, as well as companies active in the Chemicals industry.
The biodiversity impact of a company is significantly determined by the activities a company is involved in. However, the negative impacts can be mitigated by thoughtful management.
For example, when examining the Food Products industry and its potential impacts on SDG 14, Life below Water, more closely, sustainability considerations regarding food packaging are a central concern. While it might be difficult to remove packaging completely to deliver food to end consumers, negative impacts can be significantly reduced by incorporating circular economy considerations into packaging, such as reducing and reusing packaging and making use of sustainable materials. The ISS ESG Corporate Rating provides such granular insights into policies and measures taken up by individual companies.
Geographical Distribution of Biodiversity Impact
Due to globalization, companies have an impact in all the countries they have business operations in. Figure 4 shows regions where Japanese companies have biodiversity impacts across the globe, with darker colors indicating stronger impact.
Figure 4: Top 10 Countries Impacted by TOPIX 1000 Companies

Notes: Dark shades of blue indicate greater biodiversity impact. Regional outputs (e.g., RoW – Rest of the World) have been excluded from the map.
Source: ISS ESG
A significant portion (88%) of the overall biodiversity impact of Japanese companies is found in the Asia Pacific region, with 37% associated with Japan alone. Notable impacts include trading companies’ biodiversity impact in Indonesia through mining activities, impacts from food production in Japan and the United States, and the chemicals industry’s impact in China and Japan.
Ecosystem Services Dependencies of Japanese Companies
Companies do not operate in a silo – hence, impacts that corporate activities might have on biodiversity and nature in turn may well have an impact on corporate activities. The 2020 Global Futures report estimated the cost to the world economy from biodiversity loss between 2011 and 2050 could be approximately $10 trillion.
This dependence on nature is reflected in companies’ relationships with ecosystem services. An ecosystem service is a benefit that nature provides that enables or facilitates business production processes.
Ecosystem services can relate to provisioning, regulating and maintenance, or cultural services:
- Provisioning ecosystem services are a direct physical input in business production processes: for example, groundwater, which is stored underground, is often extracted for various uses, such as production of beverages or food products. Animal-based labor is another type of provisioning ecosystem service.
- Regulating and maintaining ecosystem services help mitigate the impact caused by business production processes or protect these processes from being disrupted. An example of this type of ecosystem service is climate regulation, where carbon dioxide is stored in the environment by soil, natural vegetation, and oceans. This helps in regulating the planet’s temperature naturally. Another example is vegetation that prevents erosion by holding on to the soil it is growing in.
- Cultural ecosystem services are a type of service where the ecosystem’s elements hold sacred, symbolic, or religious value for people. Such ecosystem elements also play a key role in the mental well-being of the people surrounding it.
Ecosystem services in Japan, as outlined by the Ministry of the Environment, have been declining in the past 50 years, particularly in food and timber supplies and regulatory services related to health, such as air and water purification.
In the BIAT tool, the degree to which companies depend on the availability of such services is measured by related revenues. Among Japanese companies, provisioning services are found to be the most material ecosystem services, with nearly a quarter of company revenues being dependent upon them.
Within provisioning, the most relevant service to Japanese companies is the provision of water, both ground water and surface water. The top three industries with the highest impact on biodiversity have notable revenue dependencies on water provisioning (Figure 5).
Figure 5: Ground Water and Surface Water Revenue Dependencies for the Top Three Japanese Industries with the Highest Biodiversity Impact

Source: ISS ESG
These industries are led by Trading Companies and Distributors, with about 50% of corporate revenues dependent on water provisioning, followed by Food Products (30%) and the Chemicals industry (20%).
These results are in line with the ISS ESG Water Risk Rating, where all three industries are associated with a high exposure to water risk in their supply chains. Strong water dependency in their supply chains is considered to come with potential adverse impacts on freshwater quality and quantity.
Implications for Investors
While nature and biodiversity considerations are often thought to be location-specific, neither individual companies nor a country’s economy operate in isolation. Depletion of natural resources and biodiversity loss, either through a company’s direct operations or its supply chain, may well reduce availability of ecosystem services, as well as lead to a decrease in the quality of such services for society overall.
The ISS ESG Biodiversity Impact Assessment Tool can support investors in understanding and managing both the biodiversity risk and impact of their portfolio companies. Investors may wish to engage with companies, in Japan or elsewhere, to incorporate biodiversity considerations into business strategies and improve corporate biodiversity performance to contribute to building a sustainable society in harmony with nature.
Explore ISS ESG solutions mentioned in this report:
- ISS ESG’s Biodiversity Impact Assessment Tool helps investors assess the impact of companies’ business and supply chain activities on biodiversity.
- Understand the impacts of your investments and how they support the UN Sustainable Development Goals with the ISS ESG SDG Impact Rating.
- Identify ESG risks and seize investment opportunities with the ISS ESG Corporate Rating.
- Develop engagement strategies, define achievable engagement objectives and manage your engagement process with ISS ESG’s Norm-Based Engagement Solution and Thematic Engagement Solution.
- Access a holistic assessment of companies’ exposure to freshwater-related risks using the ISS ESG Water Risk Rating.
By:
Moeka Inada, ESG Corporate Ratings, ISS ESG
Masa Kataoka, ESG Corporate Ratings, ISS ESG
Shashank Hariharnath Tripathi, ISS ESG Methodology, ISS ESG
Yuka Manabe, ESG Product, ISS ESG
自然との共生:日本企業の生物多様性への影響と依存度
概要
- 日本政府は、「生物多様性国家戦略2023-2030」において「 ネイチャー・ポジティブ」を目指し、特に生物多様性の損失と気候変動の両方に対する統合的なアプローチが必要であるとの認識を示しています。この戦略を実現するためには、生物多様性と自然資本の視点を事業活動に取り入れることが要であると考えられています。が必要であるとの認識を示しています。この戦略を実現するためには、生物多様性と自然資本の視点を事業活動に取り入れることが要であると考えられています。
- 多くの日本企業がネイチャー・ポジティブを宣言していますが、今後の課題は、それらの理念を具体的な行動に結びつけることです。日本経済団体連合会(経団連)によるメンバー企業の生物多様性への取り組みに関する最近の調査では、気候変動と生物多様性保全の関連性が確立されているケースが比較的少ないことが明らかになりました。
- 事業活動と地理的な位置情報に基づいて、企業による資源のマッピングを行ったところ、日本企業にとってウランやトリウム鉱石の採掘が生物多様性に対して最も影響力がある事業活動であることが明らかになりました。
- 日本企業全体の生物多様性へのインパクトの大部分(88%)はアジア太平洋地域における活動であり、そのうち37%は日本国内におけるものです。
- ISS ESG のBiodiversity Impact Assessment Tool (BIAT)は、企業が生物多様性に与える影響や生態系サービスへの依存度に関するデータを提供しています。BIATは、投資家による日本およびその他の国々における生物多様性への対応評価を支援します。
近年注目が高まっている環境目標のひとつに、人間の活動を「ネイチャー・ポジティブ」にするという考え方があります。ネイチャー・ポジティブとは、環境へのダメージを最小限に抑えるだけでなく、「生物種、生態系、自然プロセスの健全性や豊かさ、多様性、完全性、回復力の向上」を確かなものにするという考え方です。
ネイチャー・ポジティブなグローバルな社会経済システムへの移行は、経済的な利益ももたらします。ある試算によると、こうした移行により、2030年までに、年間10兆1,000億ドルの事業価値と3億9500万人の雇用が創出される可能性が想定されています。
日本においても「生物多様性国家戦略2023-2030」が策定され、自然喪失への対応に積極的に取り組んでいます。 当戦略は、ネイチャー・ポジティブを目指し、とくに生物多様性の損失と気候変動の両方に対する統合的なアプローチの必要性を示しています。当該戦略は、「生態系の健全性の回復」、「自然を活用した社会課題の解決」、「ネイチャー・ポジティブ経済の実現」、「生活・消費活動における生物多様性の価値の認識と行動」、そして「生物多様性に係る取組を支える基盤整備と国際連携の推進」の5つの戦略に基づいています。したがって、生物多様性と自然資本という視点を事業活動に取り入れることが、当戦略の成功に不可欠であると見なされています。
生物多様性国家戦略の目標を達成するために、日本政府は「30by30ロードマップ」を策定しました。30by30ロードマップは、昆明・モントリオール世界生物多様性枠組みに沿って、2030年までに陸域および海域の少なくとも30%を保全または保護することを目指しています。
本調査では、日本企業が生物多様性や自然環境に与える影響、および企業が生態系サービスに依存している度合いについて、全体像を把握することを目的としています。多くの日本企業がネイチャー・ポジティブを宣言していますが、まだ具体的な行動は伴っていません。
ISS ESGのBiodiversity Impact Assessment Tool(BIAT)は、企業が生物多様性に与える影響や生態系サービスへの依存度に関するデータを提供しています。BIATは、投資家による日本およびその他の国々における生物多様性への対応評価を支援します。
日本企業における生物多様性への対応
日本企業は、2023年9月に最終決定された「自然関連財務情報開示タスクフォース(TNFD)」による提言の採択に率先して取り組んできました。 グローバルのTNFDアーリーアダプター(早期採択)企業 の約25%は日本企業であり、日本はアーリーアダプター数が最も多い国です。 同様の傾向は、気候関連財務開示タスクフォース(TCFD)提言のコミットメントにも見られ、TCFDへの支持を表明する日本企業は他国に比べて非常に多くなっています。
経団連加盟企業の多くは、「自然共生社会の構築を通じた持続可能な社会の実現 」という経団連の目標にコミットしている一方で、取締役会レベルでの議論や方針の開示、生物多様性に関する定量的な目標や施策の策定を行っている企業は少ないことがうかがえます。また、「生物多様性国家戦略」で掲げられている「気候変動と生物多様性保全の関連性」が確立されているケースが比較的少ないことも明らかになりました。
日本企業の生物多様性への影響
企業は、多様な生物多様性指標を通じて、自社の生物多様性への影響を評価することができます。 潜在的に消失した種の割合(PDF)と平均種の存在量(MSA)は、最も一般的に使用されている指標であり、TNFDのガイダンスにおいても最もよく参照される指標です。
ISS ESGの Biodiversity Impact Assessment Tool (BIAT)は、企業の生物多様性への影響を測定するために、PDFとMSAの指標を算出しています。 以下の分析では、日本の上場企業のうち、時価総額上位1,000 社であるTOPIX1000銘柄とそれらの生物多様性と自然への影響と依存度を調査しています。
生物多様性へのインパクトの分布
BIATのデータによると、TNFDのアーリーアダプター企業は生物多様性への影響が大きい企業の中に数多く存在することが明らかになりました。これらの企業の半数以上が生物多様性に対して中程度から非常に高い影響を与えています。このことは、アーリーアダプター企業の一部が生物多様性を非常に重要な課題と認識していることを示唆しています。
TOPIX 1000銘柄企業の生物多様性への影響を調査したところ、60% 近くが中程度(Medium)、高程度(High)、または非常に高い(Very High)影響に分類されました。(図 1)これらの企業は、売上高を分母に算出した生物多様性インパクト(強度-Intensity)に基づくと、生物多様性に顕著な影響を与えていると考えられます。

図1:TOPIX1000銘柄企業の生物多様性インパクト分類 (Intensityで比較)
出典 ISS ESG
次に、TOPIX1000銘柄における生物多様性影響をGICSセクター別に評価しました。図2に示すとおり、「資本財・サービス(Industrials)」セクターに属する日本企業の割合が高いことから、 同セクターがTOP1000銘柄の生物多様性影響評価に最も大きな影響を与えていることが分かります。また生物多様性への影響が非常に高い (Very High) 企業の割合が最も多く分布しているセクターは、「生活必需品(Consumer Staples)」、次いで「素材(Materials)」となっています。

図2: GICSセクター別TOPIX1000企業の生物多様性へのインパクト分類 (Intensityで比較)
出典 ISS ESG
資本財・サービス、生活必需品、素材の各セクターにおいて、生物多様性への影響が最も大きい3つの産業は、「商社・流通業」、「食品」、「化学」です。以上の結果は、ISS ESGのSDG Impact Ratingによっても裏付けられており、これら3つの産業に属する日本企業は、生物多様性と自然に直接関連する2つの持続可能な開発目標であるSDG14「Life below Water: 海の豊かさを守ろう」とSDG15「Life on Land: 陸の豊かさも守ろう」に負の影響を与えていることが示されています。
生物多様性へのインパクトの要因
生物多様性及び生態系サービスに関する政府間科学-政策プラットフォーム(IPBES)の定義に基づき該当する評価の直接的な要因を分析すると、BIATツールで評価された4つのIPBESカテゴリーのうち、土地利用の変化が生物多様性の最大の損失要因となっており、次に気候変動と汚染が続きます。
さらに、企業が生物多様性に影響を与えている活動についても検証すしました。事業活動と地理的な位置情報に基づいて企業の資源をマッピングすると、生物多様性への影響が最も顕著な日本企業の事業活動は、ウランやトリウム鉱石の採掘であることが分かります。これは、日本企業が生物多様性に与える影響全体の約20%を占めています。(図3)

図3:TOPIX1000企業の生物多様性に影響を与える活動上位10項目
注記:当データセットは合計116の事業活動をカバーしており、横軸は、影響の大きいトップ10の事業活動が占める生物多様性への影響の割合を表しています。ウランおよびトリウム鉱石の採掘は、116の活動の生物多様性への影響の合計の20.45%を占めていることを意味します。
出典 ISS ESG
上位 3 項目の活動、すなわち「ウランおよびトリウム鉱石の採掘」、「食品加工」、「化学製品の製造」は、日本のトップ 1,000 企業における生物多様性への影響のうち約 50% を占めています。これらの活動に最も深く関与し、生物多様性への影響の要因となっているのは、鉱業と関連のある「商社・流通業」、「食品」、および「化学」産業です。
このように企業の生物多様性への影響は、企業が関わる活動によって大きく左右されます。しかし、適切な管理によって負の影響を軽減することは可能です。
例えば、食品業界と SDG14「Life below Water: 海の豊かさを守ろう」への潜在的影響を詳しく検証すると、食品包装に関する持続可能性への対応が最大の懸念事項であることがわかります。 食品を最終消費者まで届けるために包装を完全に廃止することは難しいかもしれませんが、包装の削減や再利用、持続可能な素材の利用など、循環経済への対応を包装に取り入れることで、負の影響を大幅に軽減することができます。 ISS ESG Corporate Ratingsでは、個々の企業が採用している方針や施策について、このような詳細な洞察を提供しています。
生物多様性へのインパクトの地理的分布
グローバル化により企業は広域に事業を展開し、そのすべての国に影響を及ぼします。図4は、日本企業が世界中で生物多様性に与える影響のある地域を示しており、色が濃いほどその影響が大きいことを示しています。
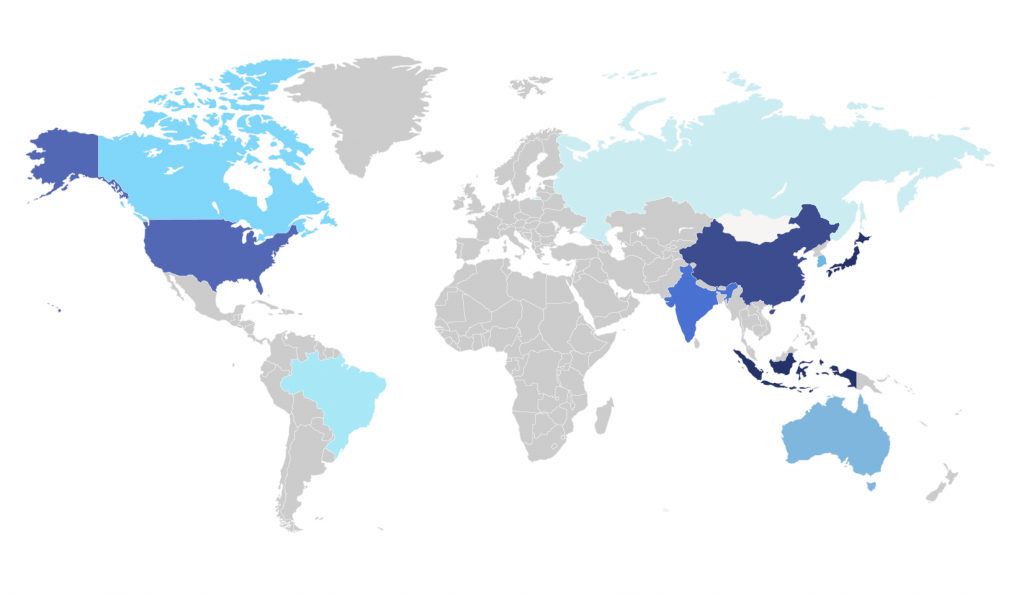
図4:TOPIX1000銘柄が生物多様性に与える影響が大きい国々(上位10カ国)
注釈 :濃い青ほど生物多様性への影響が大きいことを示しています。地域別出力(例:RoW – Rest of the World)は地図から除外されています。
出典 :ISS ESG
日本企業の生物多様性への影響の大部分(88%)はアジア太平洋地域に集中しており、そのうち37%は日本国内にあります。 注目すべき影響として、インドネシアでの商社の鉱業による生物多様性への影響、日本および米国での食料生産による影響、中国および日本での化学産業による影響などが挙げられます。
日本企業の生態系サービス依存度
企業は単独で活動しているわけではありません。そのため、企業の活動が生物多様性や自然環境に与える影響は、逆に企業の活動に影響を与える可能性も十分ありえます。2020年 の「Global Futures Report」によると、2011年から2050年までの生物多様性の損失による世界経済への損失は、約10兆ドルにのぼると推定されています。
このような自然への依存は、企業と生態系サービスとの関係に反映されています。 生態系サービスとは、自然が提供する便益であり、ビジネスの生産プロセスを可能にしたりあるいは促進したりするものです。
生態系サービスは、供給、調整・維持、文化のサービスに結びつきがあります。
- 供給生態系サービスは、企業の生産プロセスにおいて直接的な物理的投入を指します。例えば、地下に蓄えられた地下水は、飲料や食品の製造など、さまざまな用途で採取されます。また、動物を活用した労働も生態系サービスの「供給」の一環です。
- 生態系サービスの調整と維持は、企業の生産プロセスによる影響を緩和し、同プロセスが中断される事態から回避する役割を果たします。気候調整はその一例であり、土壌、植生、海洋が二酸化炭素を吸収して地球の温度を自然に調整しています。また、植物が自身の育つ土壌を保持し侵食を防ぐことも、生態系サービスの例です。
- 文化生態系サービスは、生態系の要素が人々にとって尊重の対象であり、象徴的または宗教的な価値を持つサービスの種類です。これらの要素は、人々の精神的健康にも重要な役割を果たしています。
環境省の概説によると、日本の生態系サービスでは、過去50年間で特に食料や木材の供給や、大気や水の浄化といった健康に関する調整サービスにおける低下が見られます。
BIATツールでは、企業がこうしたサービスの利用可能性にどの程度依存しているかを関連収益で測定します。日本企業では、供給サービス(provisioning services)が生態系サービスの中で最も重要であり、企業収益の4分の1近くがこれらのサービスに依存していることが判明しました。
供給サービスの中で、日本企業にとって最も関係の深いサービスは、「地下水と地表水双方の水の供給」です。下図の通り、生物多様性への影響が大きい上位3つの産業は、水供給サービスへの収益依存度が高いことが分かります。(図5)
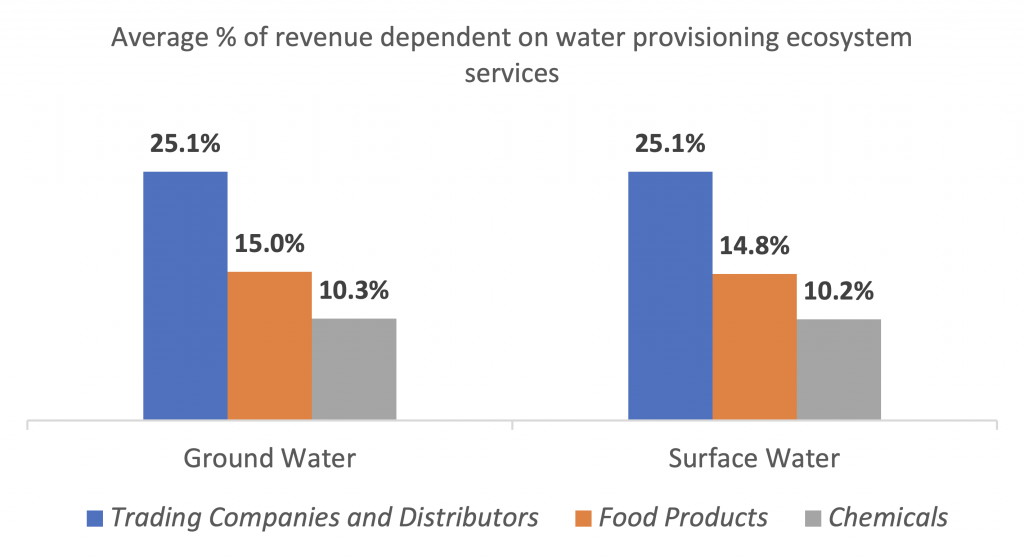
図5:生物多様性への影響が最も大きい日本の産業トップ3における地下水と地表水の収益依存度
出典 ISS ESG
これらの産業は商社や流通業者が主導しており、企業収益の約50%が水の供給に依存しています。次いで食品(30%)と化学(20%)がこれに続きます。
上記の結果は、ISS ESG Water Risk Ratingと一致しており、3つの産業はいずれもサプライチェーンにおける水リスクへの高いエクスポージャーと関連付けられています。サプライチェーンにおける水への高い依存は、淡水の質と量に負の影響を及ぼす可能性があると考えられています。
投資家への示唆
自然や生物多様性への対応は、特定の地域に限定されたものと捉えらがちですが、個々の企業も国の経済も単独で存在しているわけではありません。企業の直接的な事業活動やサプライチェーンを通じて自然資源の枯渇や生物多様性が失われた場合、生態系サービスの利用可能性が低下し、社会全体にとってそのサービスの質が低下する可能性が十分ありえます。
ISS ESG Biodiversity Impact Assessment Toolは、投資家がポートフォリオ内の企業の生物多様性リスクと影響を把握し管理することを支援します。投資家は、日本やその他の国の企業とのエンゲージメントに携わることにより、生物多様性への対応を事業戦略に取り込むことで、企業のパフォーマンスを向上させ、延いては自然と調和した持続可能な社会の構築に貢献することが期待されています。
本レポートでご紹介したISS ESGのサービスについて:
- ISS ESG Biodiversity Impact Assessment Tool:企業の事業およびサプライチェーン活動が生物多様性に与える影響を評価。
- ISS ESG SDG Impact Rating:国連持続可能な開発目標(SDGs)への投資の影響と貢献度を評価。
- ISS ESG Corporate Rating: 企業のESGリスク、機会、影響を評価。
- Norm-Based Engagement Solution / Thematic Engagement Solution:エンゲージメント戦略を策定し、達成可能なエンゲージメント目標を定義し、エンゲージメントプロセスを管理。
- ISS ESG Water Risk Rating:企業が抱える淡水関連リスクを総合的に評価。
執筆者:
ISS ESG ESGコーポレート・レーティング リサーチ部門 稲田萌花
ISS ESG ESGコーポレート・レーティング リサーチ部門 片岡正継
ISS ESG メソドロジー部門 Shashank Hariharnath Tripathi
ISS ESG プロダクト部門 真辺佑佳