The summer of 2020 was a turning point in the push for corporate diversity and inclusion initiatives. The tragic murder of George Floyd and the reactions that followed it resulted in demands for racial equality and anti-racism measures that resounded across the globe, including the corporate world.
Subsequently, many companies pledged to do their part to address inequalities and, likewise, many investors began to seriously reflect on their racial and ethnic diversity policies. Some investors adopted or strengthened their proxy voting policies demanding greater transparency from their portfolio companies around racial and ethnic diversity information, believing that which cannot be measured cannot be managed. Others adopted explicit requirements on board diversity in the form of minimum absolute number or percentage of corporate board seats going to racially/ethnically diverse director candidates. As the ISS board diversity data shows, there has been visible progress since 2020 in the number of racially/ethnically diverse directors on US company boards, and this uptick in diversity and inclusion initiatives has been dubbed by some “The George Floyd Effect”.
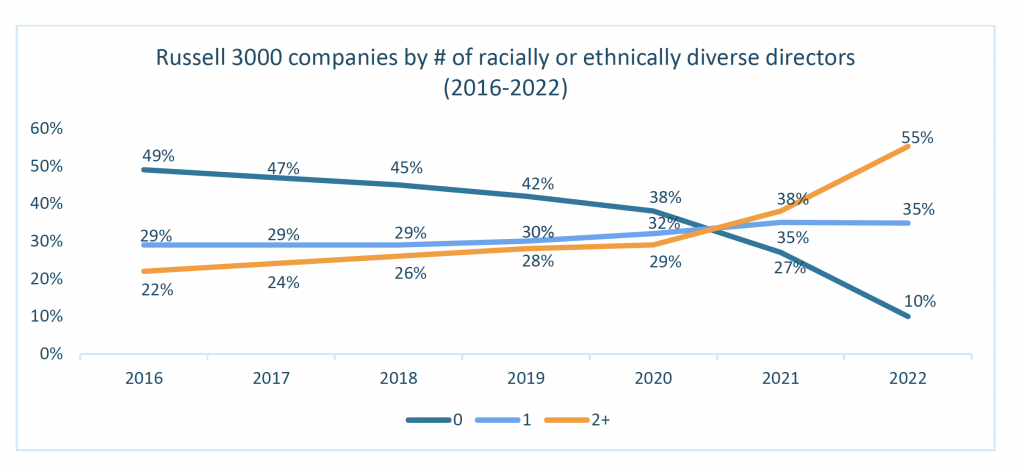
Taking a measurement point at the end of every US proxy season, two years on, the results show racial/ethnic diversity increases on U.S. boards, both at large- and mid-caps. The graph below shows that the percentage of Russell 3000 companies with no racial/ethnic diversity on their boards went down from 38 percent in 2020 to 10 percent in 2022. The percentage of companies with one racially/ethnically diverse director increased slightly from 32 percent in 2020 to 35 percent in 2022. Additionally, the percentage of companies with two or more racially/ethnically diverse directors went up from 29 percent in 2020 to 55 percent in 2022.
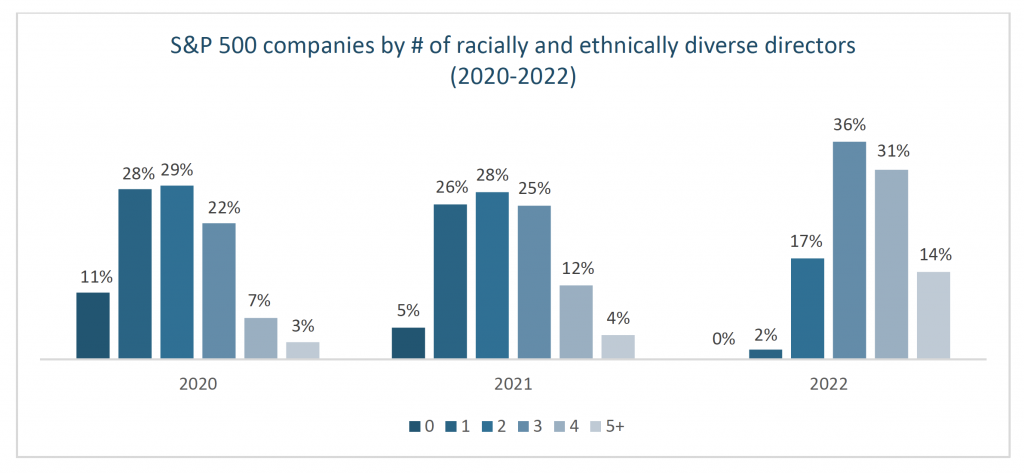
As the following graph demonstrates, 2022 has set a record by being the first year when all S&P 500 companies included at least one racially/ethnically diverse director, with the number of non-diverse S&P 500 boards going from 11 percent in 2020 to 5 percent in 2021 and zero in 2022. A record 36 percent of S&P 500 companies now have three racially/ethnically diverse directors on board. And 31 percent of companies have four racially/ethnically diverse directors.
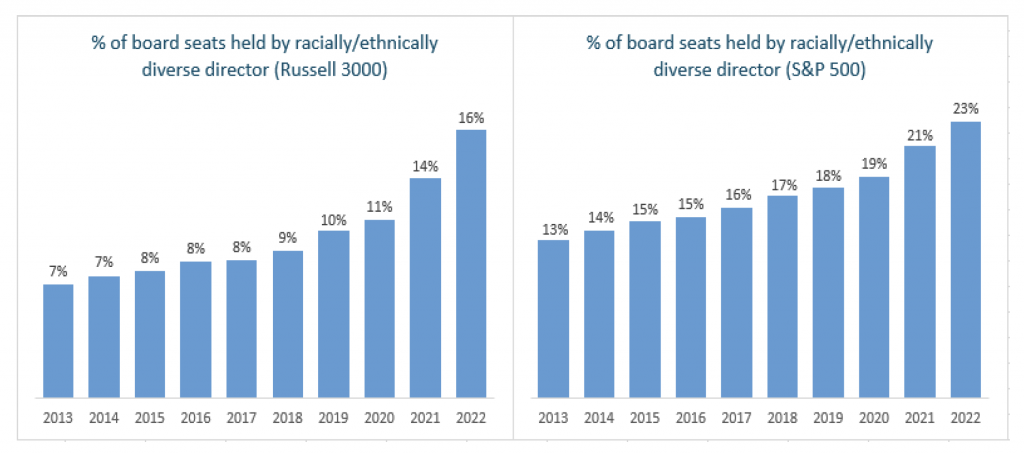
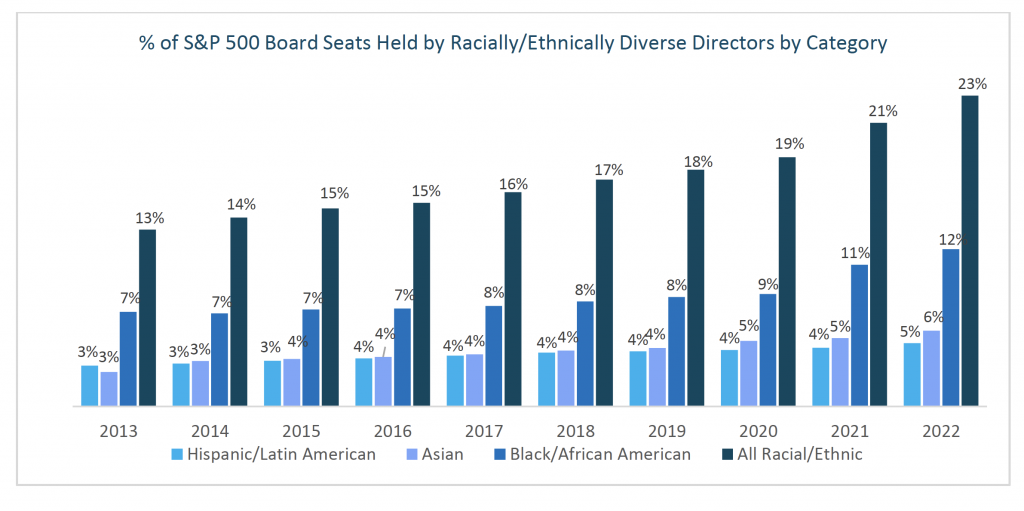
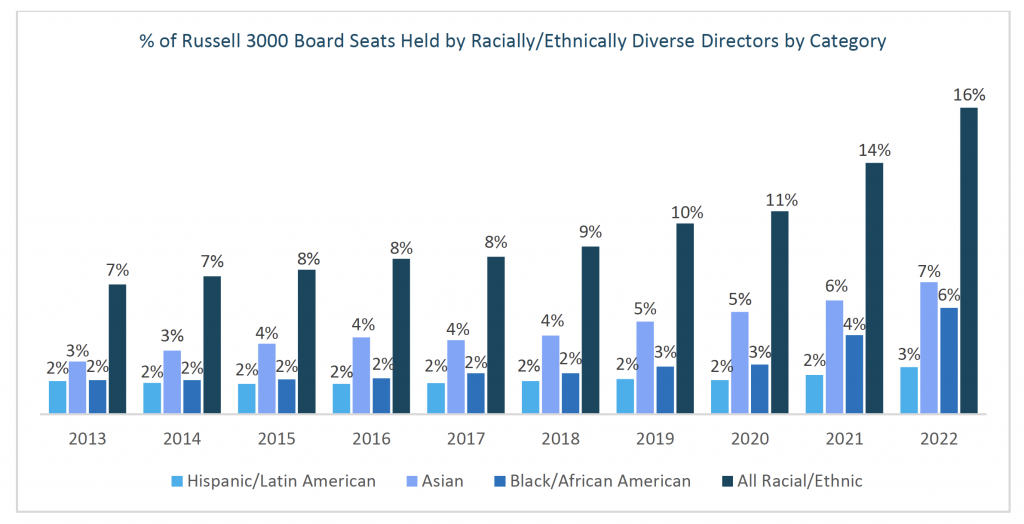
During the period from 2020 to mid-2022, the aggregate rate of increase in racial/ethnic board diversity of the S&P 500 index doubled, while the Russell 3000 index moved at an even faster clip (see below graph).
The rate of progress was unevenly distributed, however. Board diversity for the S&P 500 index showed the least progress for directors identifying as Hispanic/Latin American compared to their share of the wider US population (see below graph). According to the census taken on April 1, 2020, those classified as “Hispanic or Latino” made up 18.5% of the U.S. population, but occupied only 5% of S&P 500 board seats.
For the Russell 3000 index, in 2022 Black/African American and Hispanic/Latin American directors occupied 6% and 3%, respectively, of total board seats available (see below graph). While both groups registered progress relative to previous years, constituents of the Russell 3000 index lagged significantly behind their S&P 500 counterparts.
Conclusion
ISS board diversity data shows the progress that has been made since the tragic murder of George Floyd in 2020. However, many boards still do not reflect the diversity of their customer base or the demographics of the broader society in which they operate.
While there is cause to celebrate the progress that has been made in recent years, many companies are expected to grapple with board diversity issues – along with c-suite diversity, workforce equity and fair pay – for the foreseeable future, as the long-term trajectory of many corporate diversity and inclusion initiatives has yet to be seen.
By: Fassil Michael
