This is the first in a three-part series covering the global investment market, utilizing insights from ISS Market Intelligence’s recently launched Simfund Total Market. Covering 120K products and funds representing nearly $100 trillion in AUM, Simfund Total Market provides the most comprehensive view of institutional and retail assets globally.
The rapid growth of competing investment vehicles has been an existential concern for the mutual fund structure—and the managers who rely on it throughout the past decade. While exchange-traded funds (ETFs) have grabbed the most attention within the registered U.S. fund market, investors have flocked to a variety of vehicles across the globe. Data from ISS MI’s newest Simfund Total Market module sheds light on the variety of sources of competition the mutual fund faces, covering nearly $100 trillion in assets under management (AUM) across retail and institutional markets as of June 2022.
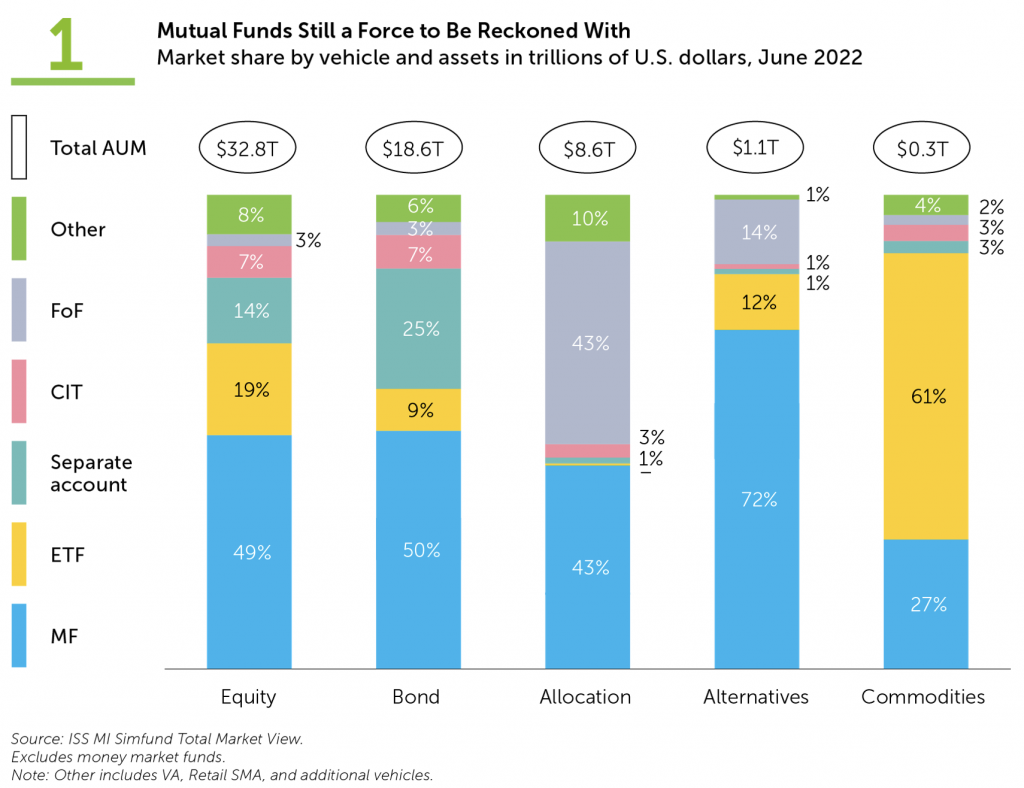
While the mutual fund has seen an erosion in its market share, it remains a central way for consumers to access professional investment management. When observing global retail and institutional markets, the vehicle remains the largest one across every asset class with the exception of commodities, the smallest asset class covered here. Figure 1 below displays market share by vehicle and broad asset classes, emphasizing that the plurality of assets is held by mutual funds.

The shift towards passive investing and extremely low-cost broad market exposure is most strongly reflected across equity funds, where ETFs have grown to account for the second-largest vehicle and a total $6.4 trillion in global AUM. With the combination of a historical preference for active management in the fixed income realm and aging populations driving up bond allocations, mutual funds continued to compose effectively half of assets in that category, followed by separate accounts. Funds of funds, meanwhile, were nearly equal in total AUM to mutual funds within the allocation asset class, as managers employ multi-asset solutions which can invest within their own proprietary lineups.
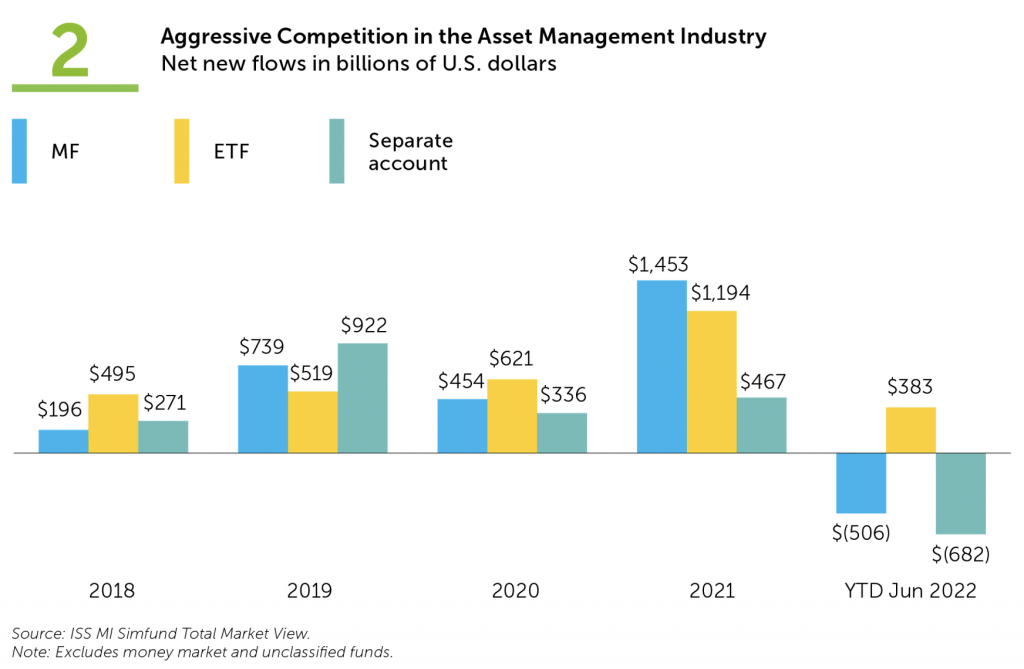
ETFs have recorded the most rapid growth, achieving a compound annual growth rate (CAGR) of 16.0% between 2017 and 2021. Mutual funds though still recorded a relatively healthy CAGR of 7.0% over that period, compared to 4.7% for separate accounts, and continue to act as a strong source of demand. Figure 2 displays net new flows for the largest vehicles in recent years. Mutual funds have faced severe outflows amidst the drastic market downturns seen across 2022, but also recorded the highest flows over the previous year, with net deposits just shy of $1.5 trillion.

These numbers highlight the scale of competition between vehicles, but a further dive can illuminate how competitive the investment management market is within each vehicle. The Herfindahl-Hirschman Index (HHI) measures market concentration and is employed by government bodies like the United States Department of Justice and the Federal Trade Commission to assess whether certain industry mergers or acquisitions should receive approval. Calculated by squaring the market share of each firm in a specific market, the HHI ranges from zero to 10,000. Figures below 1,500 represent a competitive market, while numbers between 1,500 and 2,500 indicate moderate market concentration and those above 2,500 indicate a highly concentrated market.
While admittedly a blunt measure, the index provides an intuitive figure that emphasizes how severe market concentration is across different vehicles. Figure 3 displays the HHI figures for mutual funds, ETFs, and separate accounts, highlighting the extreme gap across the three. It additionally features an equivalent firms calculation, an inverse of the HHI, which equates to how many firms would exist in the market if the firms were equally sized. That latter figure ranges in the high 30s and 40s for mutual funds and separate accounts but plunges to six for ETFs.
The mutual fund’s century-long legacy has allowed a large number of firms to build their business in the vehicle across a variety of strategies and for abundant use cases. Unlike the more standardized strategies of the mutual fund or ETF, which benefit greatly from an economy of scale, strategies for separate accounts are often highly personalized to their clients, limiting the extent to which the structure can produce a winner-take-all environment. With ETFs being widely available through exchanges and a comparatively novel structure, a small number of funds and hence a small number of providers can have an outsized impact and account for a much larger proportion of market share.

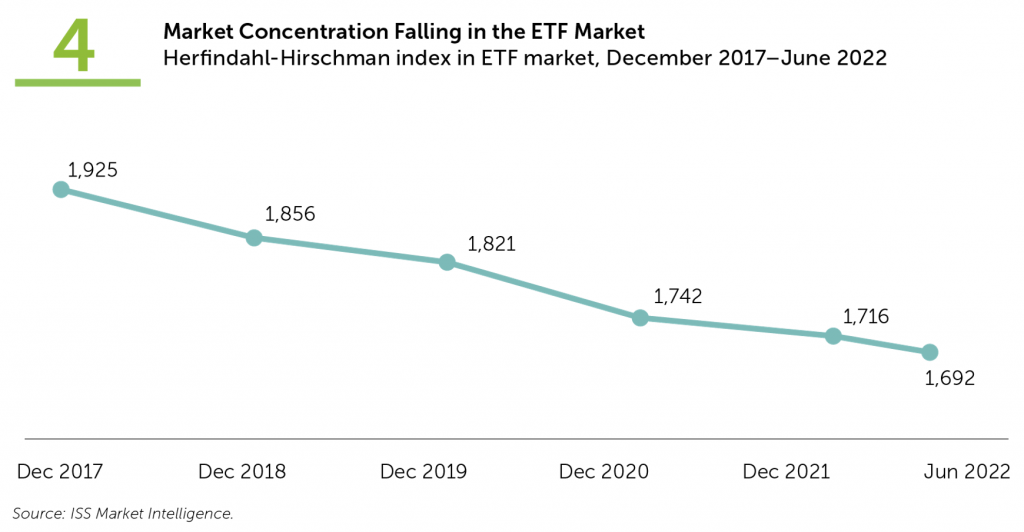
However, the high degree of concentration in the ETF market is not fixed; as seen in Figure 4, the HHI has declined consistently for the last five years, with the “effective” number of firms in the market growing by 13.7% in that period. As the ETF continues to mature as a vehicle and managers increasingly use it outside large-cap exposure, it could someday reach the level of market competition seen in other vehicles.

By: Alan Hess, Associate Vice President, U.S. Fund Research, ISS Market Intelligence
Liam Stewart, Senior Research Analyst, U.S. Fund Research, ISS Market Intelligence


