KEY TAKEAWAYS
- Reflecting their strong contribution to major indices, the so-called Magnificent 7 U.S. stocks have been a major focus of investor attention. This article considers the sustainability performance of the Magnificent 7 compared with the remaining equities in the STOXX USA 500.
- The article examines six ESG and climate metrics and considers aggregate performance as well as the dispersion in the data. The Magnificent 7’s financial strength is also reviewed using the Economic Value Added (EVA)-based ISS Financial Rating.
- The Magnificent 7 perform very well across overall ESG performance, carbon risk, emissions, and temperature scenario alignment as well as adequately on water risk. Nonetheless, they notably lag in alignment with the U.N. Sustainable Development Goals.
- While the aggregate results provide insight, for investors the most valuable aspect of this analysis might be to understand the dispersion within the Magnificent 7 and the specific risks and opportunities individual corporate performance present.
Driver of U.S. Market Returns
Over the past several years the so-called Magnificent 7 U.S. technology stocks have been a major focus of investor attention. For instance, according to J.P. Morgan Asset Management’s Guide to the Markets, through the end of August 2024 these seven stocks have accounted for the majority of the US equity market returns since 2022. Reflecting their size, as of the end of August these equities represented approximately 29% of the market value of the STOXX USA 500 index.
As shown in Figure 1, while investors may sometimes treat this group homogeneously, there has been significant dispersion in their market performance, with wide variation between the top, bottom, and median performers.
Figure 1: Magnificent 7 Performance Dispersion
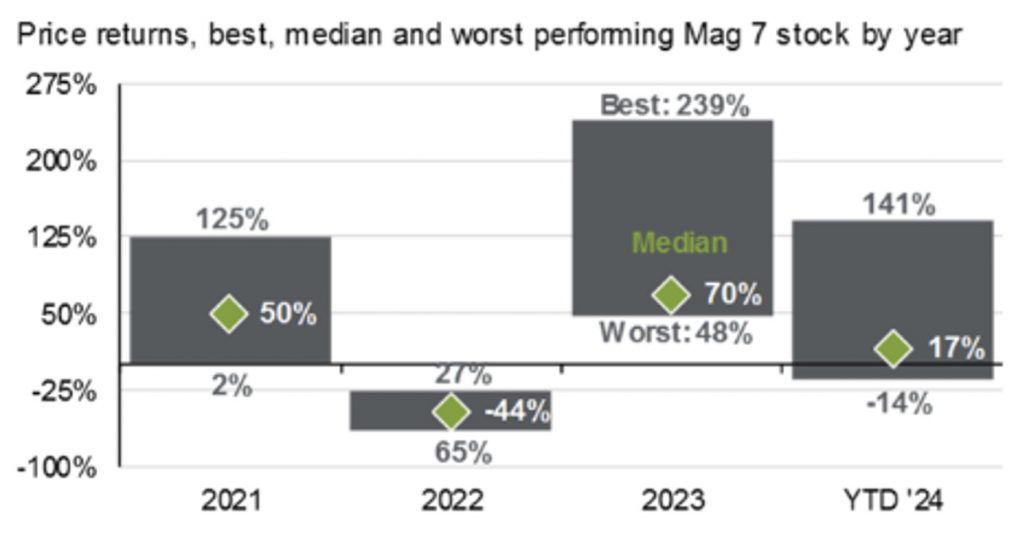
Source: J.P. Morgan Asset Management as of August 31, 2024
This article considers the sustainability performance of the Magnificent 7 compared with the remaining equities in the STOXX USA 500. The article examines a variety of ESG and climate metrics and considers the aggregate performance as well as the dispersion in this data. The Magnificent 7’s financial strength is also reviewed, using the Economic Value Added (EVA)-based ISS Financial Rating. The Financial Rating incorporates both profitability and risk, powered by ISS’s proprietary EVA methodology.
Visualizing Sustainability Metrics
This article first considers the ESG Performance Score. This metric evaluates a company’s demonstrated ability to adequately manage material ESG risks, mitigate negative and generate positive social and environmental impacts, and capitalize on sustainable development opportunities. The ESG Performance Score is assessed on a 0-100 scale with higher values indicating better performance and embeds industry-specific E, S, and G indicators weighted by their materiality.
In Figure 2 and all those which follow, the left side shows the indicated metric for the Magnificent 7, while on the right side are the remaining stocks in the STOXX USA 500 index. Each company is represented by a dot, and a diamond indicates the weighted average of each group. The shading represents the statistical distribution of the companies.
Figure 2: ISS ESG Performance Score
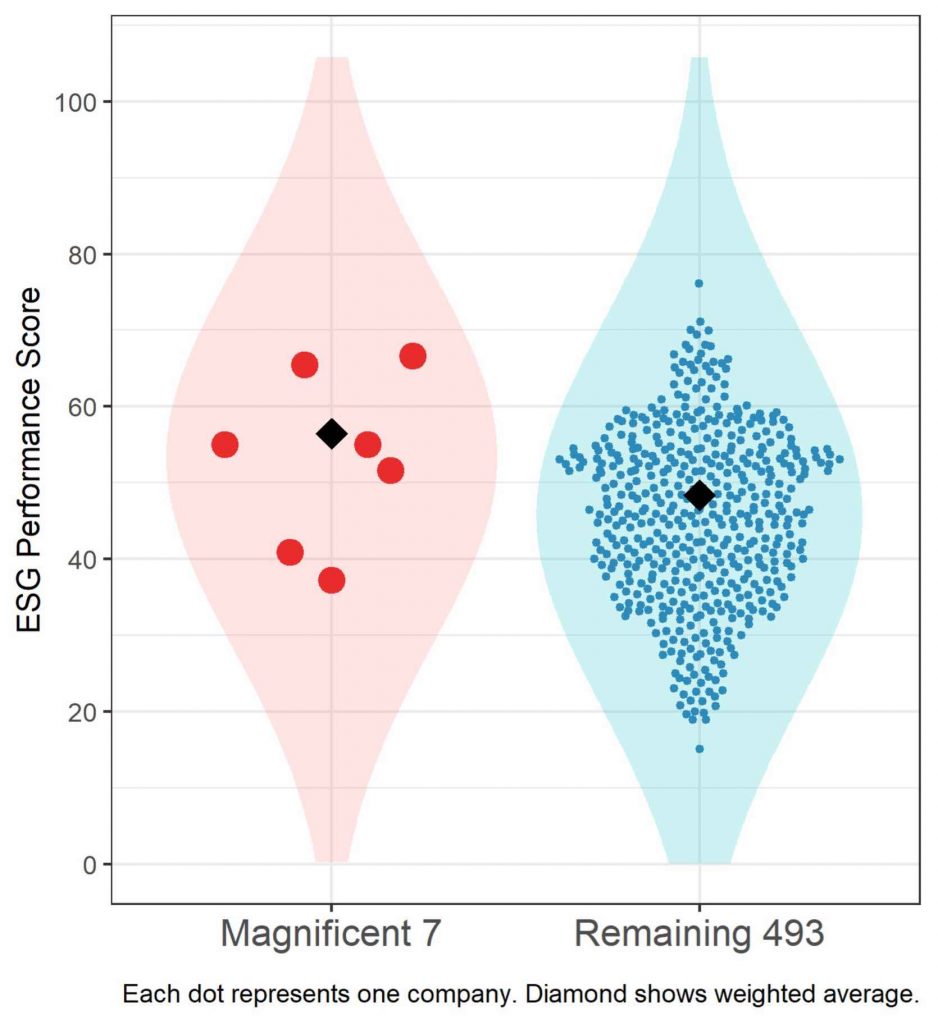
Source: ISS STOXX
The Magnificent 7 score 56.4 while the remaining companies are meaningfully below that at 48.4. It’s interesting to note that five of the seven score above 50, which is the threshold indicating ISS ESG’s Prime status of best-in-class sustainability performance by industry. Overall, despite the two lower-scoring companies, the “7” in aggregate display strong ESG performance.
Next, Figure 3 shows the Carbon Risk Rating (CRR), which focuses exclusively on the climate-related performance of companies. The CRR integrates not only CO2 emissions and efficiency, but also the extent to which a company is prepared for the challenges of global warming and can seize opportunities arising from the transition to a low-carbon economy. It is also assessed on a 0-100 scale, with higher values indicating better readiness or lower risk.
Figure 3: ISS ESG Carbon Risk Rating
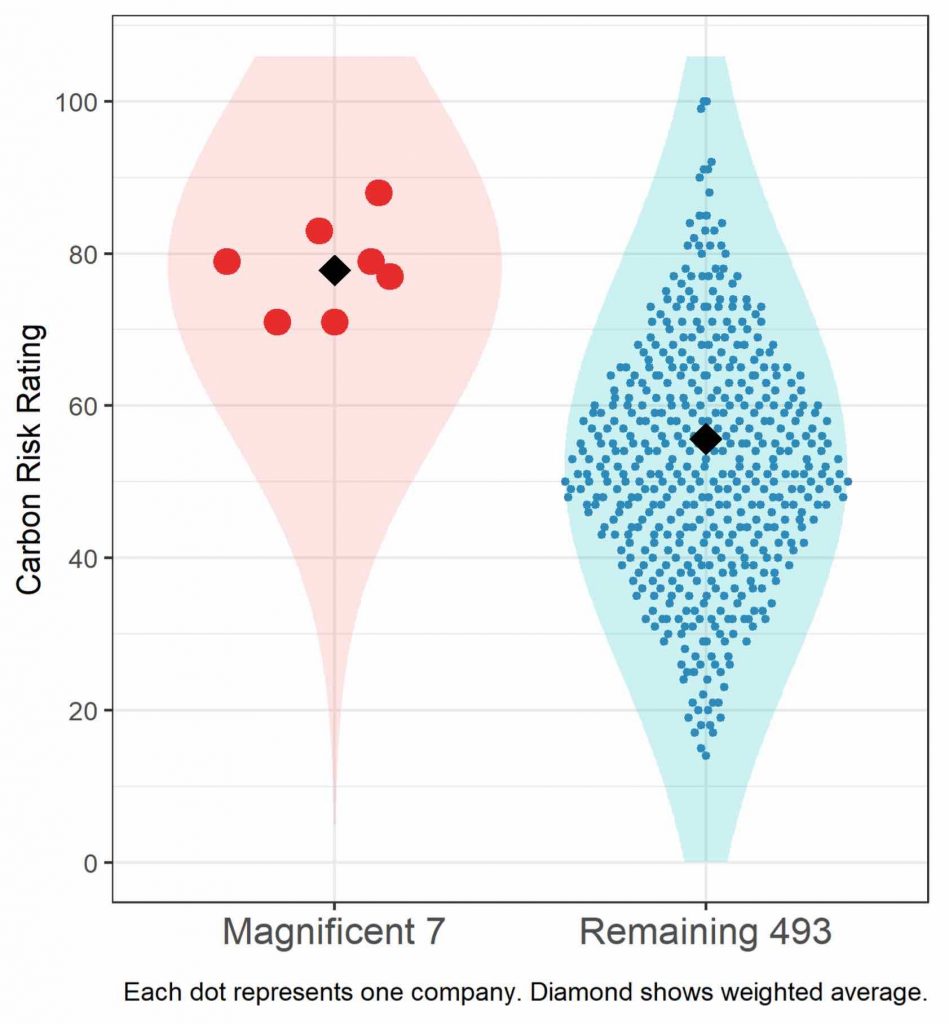
Source: ISS STOXX
The Magnificent 7 perform particularly well on this measure, scoring 77.8 while the remaining companies are well below that at 55.7. Owing to their business models and robust climate plans, even the bottom-scoring Magnificent 7 perform significantly better than the remaining companies’ average.
The U.N. Sustainable Development Goals (SDGs) provide a framework for directing investments towards sustainable development priorities. Based on this framework, the ISS SDG Impact Rating holistically scores a company’s positive or negative impact on the 17 SDGs.
Figure 4 shows the overall SDG rating, which is measured on a -10 to +10 scale, with negative values indicating obstruction and positive values indicating alignment. The rating is based on each company’s products and services, operations, and controversies. Compared with the ESG rating, the SDG Impact Rating offers a more targeted measure of alignment with global development priorities.
Figure 4: ISS SDG Impact Rating
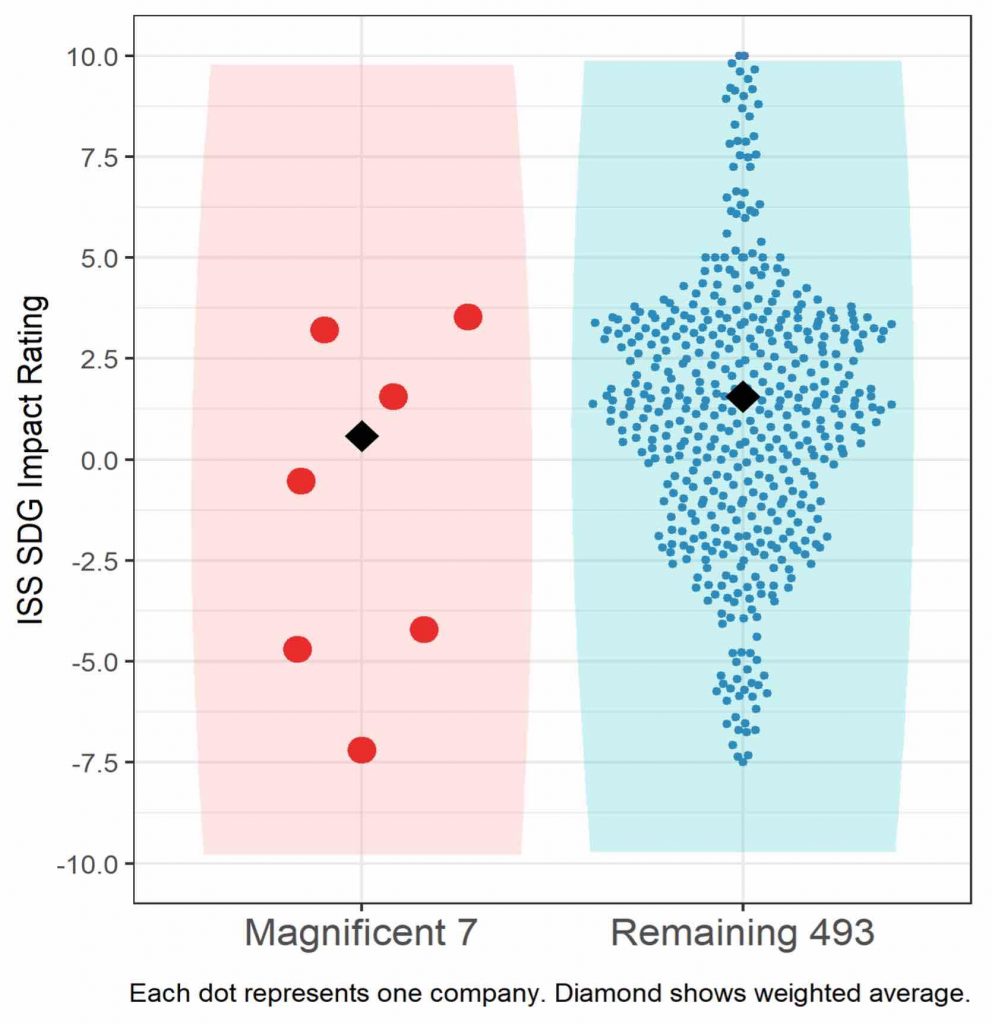
Source: ISS STOXX
As shown, the Magnificent 7 performance is mixed by this metric, with three issuers showing alignment and four showing obstruction. On a weighted average basis, the “7” perform slightly below the rest of the index at 0.6, while the remaining companies are at 1.6. The contrast with the ESG rating could point to a product and services mix that is not particularly well aligned with the SDGs, notwithstanding good sustainability in corporate operations.
While the Carbon Risk Rating provides a forward-looking assessment of preparedness for the low-carbon transition, many investors remain focused on current emissions and emissions intensity, given their importance. Below, Figure 5 shows the Scope 1+2 emissions intensity of these companies. Note that, given the wide dispersion in this data, this is shown on a log scale.
Figure 5: Carbon Emissions Intensity
(Scope 1+2 / Revenue)
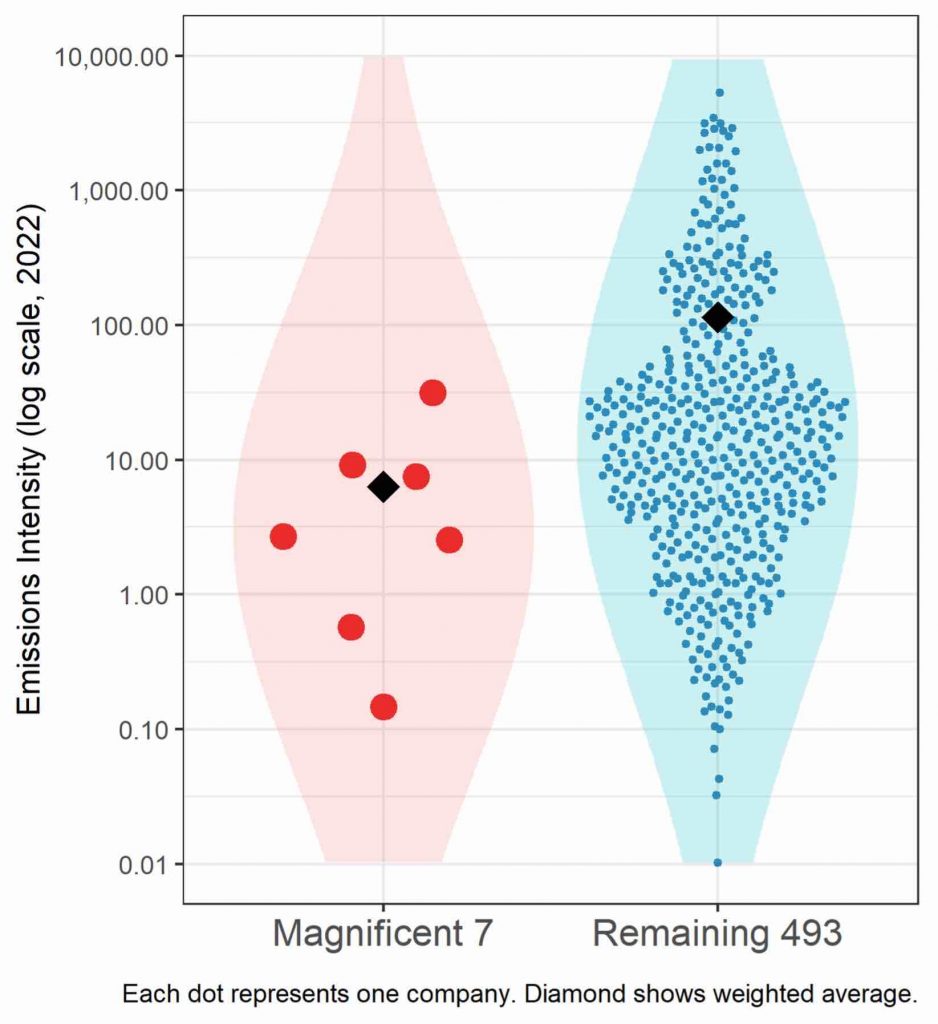
Source: ISS STOXX
As shown, the Magnificent 7 have comparatively quite low emissions intensity, with even the highest intensity company of the seven performing better than the average of the remaining companies. On a weighted average basis, the “7” have a weighted intensity of 6.3, while the remaining companies are at 114.6. It should be noted that notwithstanding their comparatively impressive performance on emissions intensity, this is a metric that is significantly influenced by these companies’ very large revenues.
A separate forward-looking climate metric is the implied temperature rise (ITR), shown in Figure 6. For every company, given its current and projected emissions, as well as a global carbon budget, this metric provides an assessment of the temperature rise scenario the company aligns with. While a variety of projections and scenarios are available in the ISS climate scenario analysis toolkit, Figure 6 below shows the International Energy Agency’s 2050 Net Zero Scenario alignment, considering company-announced emissions targets. The ITRs range from 1.4° to 6.0°.
Figure 6: Implied Temperature Rise
(IEA 2050 Net Zero Scenario with Company Targets)
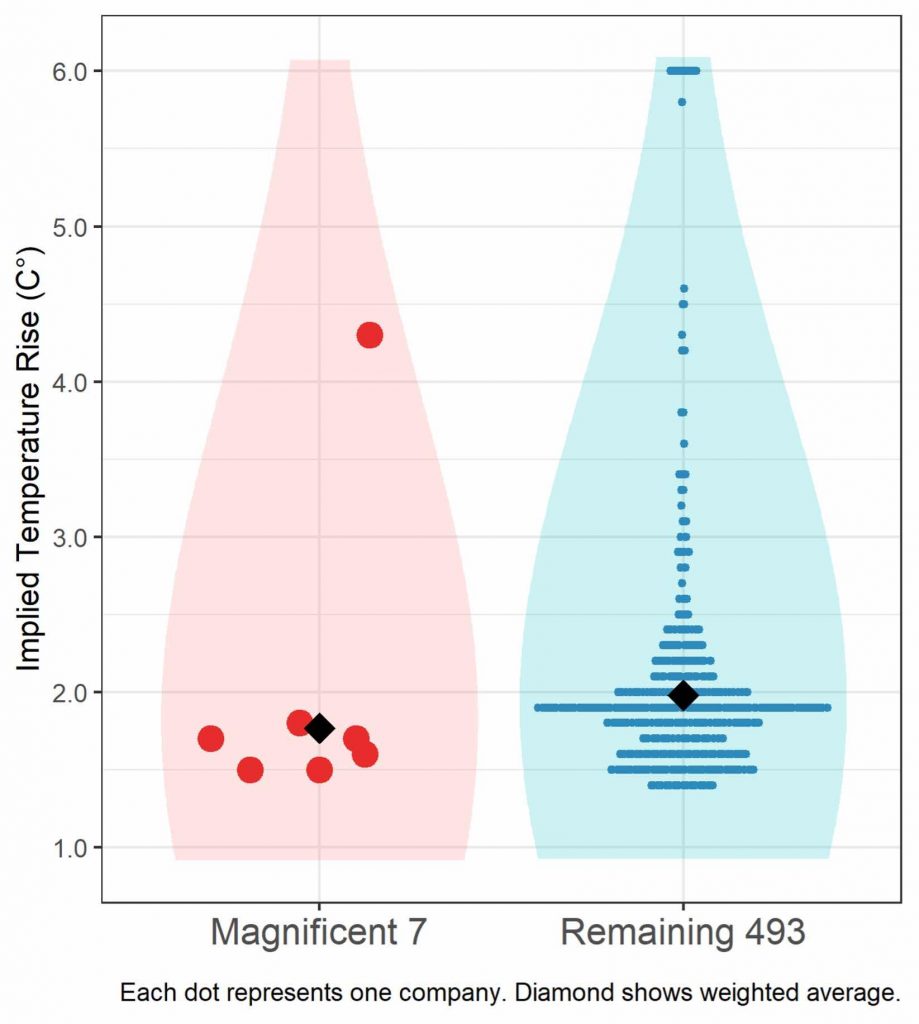
Source: ISS STOXX
As shown, all but one of the Magnificent 7 have ITRs below the 2° C upper limit of the Paris Agreement, while two of them are at the ambitious target of 1.5° C. On a weighted average basis, the “7” perform slightly better, being 0.2° below the rest of the index at 1.8° while the remaining companies are at 2°. Furthermore, none are near the upper limit of 6.0°, though one of them is above 4°. While ITRs should not be viewed in isolation of other climate metrics, they provide a straightforward-to-relate-to data point that can aid in climate risk analysis.
The final sustainability metric presented in this analysis is the Water Risk Rating (WRR). As climate change and increasing demand produce water scarcity in regions of the world, the WRR holistically assesses a company’s exposure and management of freshwater risks. Exposure consists of a company’s freshwater risks based on its industry, geographic footprint, and supply chain. Risk management integrates operational performance and management, as well as relevant controversies. The WRR runs on a scale from 0 to 100, with higher values indicating lower risk.
Figure 7: ISS ESG Water Risk Rating
Source: ISS STOXX
The growth in large-scale data centers and their consequent demand for water have been a topic of recent investor interest which could particularly affect the Magnificent 7. As shown, the Magnificent 7 performance is very mixed by this metric, with four showing very high or medium risk and three low risk. On a weighted average basis, the “7” perform slightly better than the rest of the index at 54.4, while the remaining companies are at 48.9. The bottom performers on water risk could be of particular interest to investors, given the centrality of data operations to their business models.
Financial Performance through an EVA Lens
Looking beyond ESG metrics, ISS ESG also calculates a Financial Rating that incorporates profitability and financial risk measures. The profitability aspect captures the level and trend of economic value creation based on EVA Margin (EVA/Sales) and EVA Spread (EVA/Capital). The risk portion incorporates stock price and profit volatility as well as balance sheet and cash flow vulnerability, among other leverage measures.
Figure 8 illustrates the overall Financial Rating, which is assessed on a 1-4 scale, where higher values indicate better risk-adjusted profitability.
Figure 8: ISS ESG EVA Financial Rating
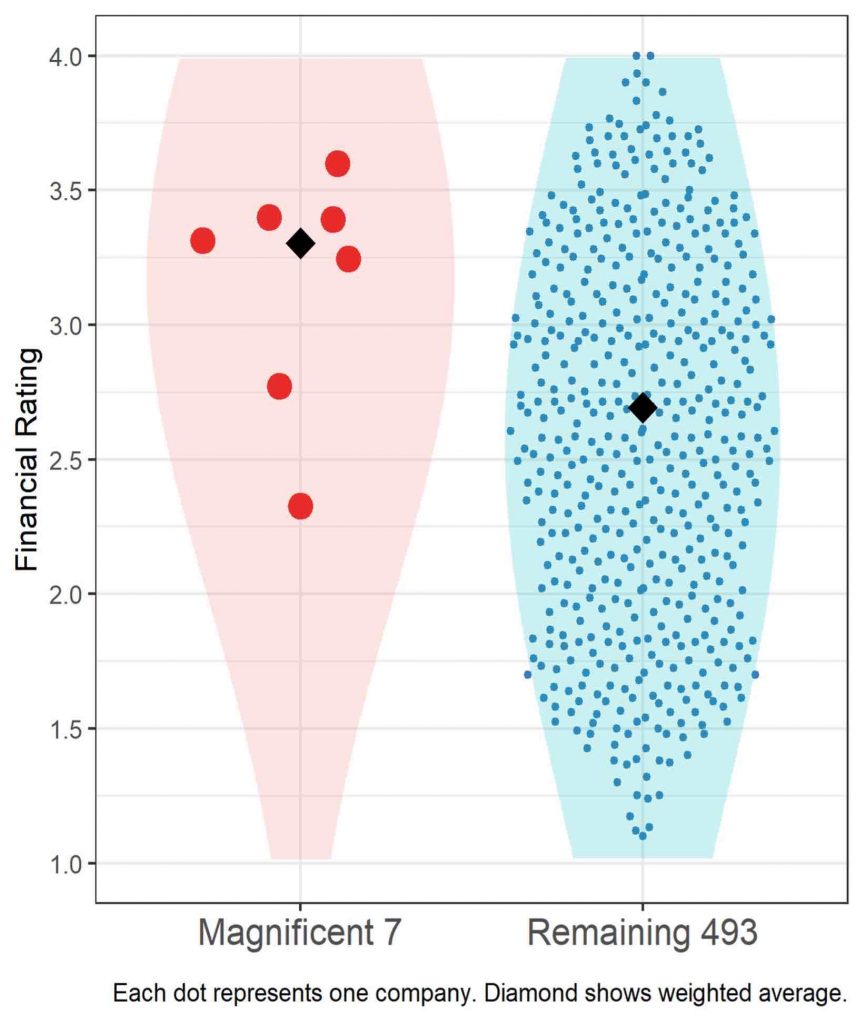
Source: ISS STOXX
As shown, overall, the Magnificent 7’s financial rating is comparatively strong and well above the market’s weighted average. Nonetheless, the ratings show some dispersion, with five of the seven stocks performing very strongly, one company near the average of the remaining, and one company below average. On a weighted average basis, the “7” have a weighted financial rating of 3.3, while the remaining companies are at 2.7. Considering their significant weight in the STOXX USA 500 index, understanding where the financial vulnerabilities might lie could be of strong interest to investors.
Strong Overall Sustainability but Lagging in SDG Alignment
In summary, this article reviews the sustainability performance of the Magnificent 7 based on six separate ESG and climate metrics, comparing them with the remaining equities in the STOXX USA 500 index. While many other metrics could be added to this analysis, these represent a broad cross-section of material sustainability issues. Overall, as shown in Figure 9, the Magnificent 7 perform very well across overall ESG performance, carbon risk, emissions, and temperature scenario alignment as well as adequately on water risk.
Figure 9: Weighted Average Sustainability & Financial Metrics
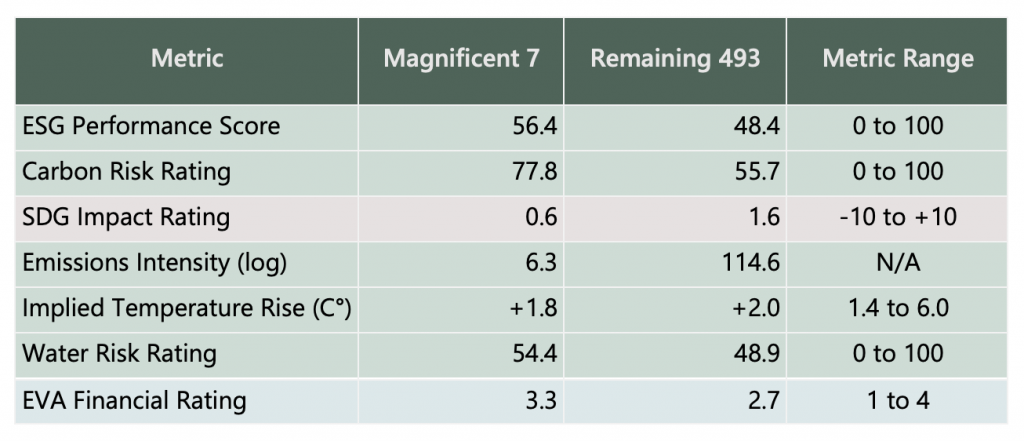
Source: ISS STOXX
Nonetheless, the Magnificent 7 notably lag the remaining companies in alignment with the U.N. Sustainable Development Goals. Given their overall positive sustainability metrics, this area of lackluster performance may be of particular interest to sustainability investment teams. Water risk may also warrant a deeper examination, as two of the seven show particularly high water risk.
While the aggregate results in this article provide insight, for investors the most valuable aspect of this analysis might be to understand the dispersion within the Magnificent 7 at the security level and the specific risks and opportunities individual corporate performance present. Finally, the article also includes ISS ESG’s Economic Value Added-based financial rating, which also shows overall strength for the “7,” with some noteworthy relative laggards as well.
Explore ISS ESG solutions mentioned in this report:
- Identify ESG risks and seize investment opportunities with the ISS ESG Corporate Rating.
- Use ISS ESG Climate Solutions to help you gain a better understanding of your exposure to climate-related risks and use the insights to safeguard your investment portfolios.
- Understand the impacts of your investments and how they support the UN Sustainable Development Goals with the ISS ESG SDG Solutions Assessment and SDG Impact Rating.
- Develop engagement strategies, define achievable engagement objectives and manage your engagement process with ISS ESG’s Norm-Based Engagement Solution and Thematic Engagement Solution.
- Understand the F in ESGF using the ISS EVA solution.
By: Hernando Cortina, CFA, Managing Director, ISS ESG