
Key Takeaways
- While emissions disclosure has expanded significantly, data credibility—using the principles defined by the Partnership for Carbon Accounting Financials (PCAF) standards—remains uneven across regions and sectors.
- European and other developed‑market issuers, particularly in high‑impact industries, continue to lead in third‑party verification, which reinforces the reliability of reported emissions. However, developing markets are narrowing the gap as verification practices improve.
- For investors, these patterns highlight the availability of verified emissions disclosure across key sectors and may prove critical to transforming climate disclosures into trusted, decision‑useful insights for global capital markets.
Investors are increasingly reliant on corporate reported emissions data to assess climate risk and opportunities. But the proliferation of disclosure frameworks and varying levels of verification raise concerns about data quality and comparability.
This article critically evaluates emissions data quality in high-impact industries by analyzing emissions (Scope 1 & Scope 2) coverage and data quality using the principles defined by the Partnership for Carbon Accounting Financials (PCAF) standards. The analysis highlights disclosure and verification levels across sectors and regions. The results indicate that verified disclosure tends to be higher among companies in Europe than in North America and among companies in developed markets than in developing markets.
Overview of Corporate Emissions Disclosures
This article examines trends in emissions disclosure among companies within the ISS STOXX universe, covering approximately 10,000 disclosing companies out of a total universe of nearly 30,000. Enterprise Value Including Cash (EVIC) is used as the weighting metric to ensure that companies with the greatest economic significance are appropriately represented.
Reported coverage of issuers has shown a strong upward trend over the past five years. As shown in Figure 1, the share of issuers reporting emissions rose from 70% in 2021 to 84% in both 2023 and 2024, and the current value of disclosure for 2025 is 82%. Correspondingly, reliance on modelled emissions fell steadily from 30% in 2021 to 16% in 2023 and 2024, with a modest increase to 18% in 2025.
Figure 1: Corporate Emissions Reported and Modelled in the Coverage Universe
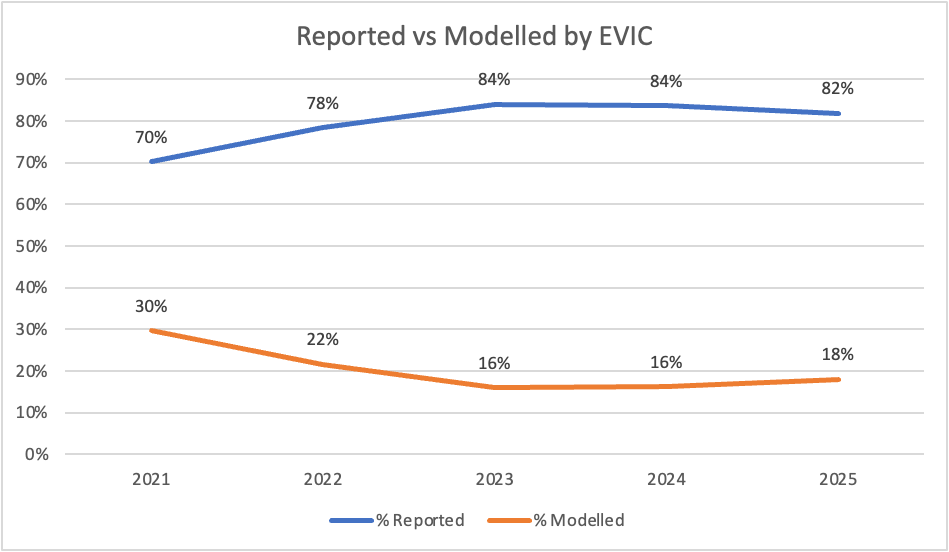
Source: ISS STOXX
The slight decline in reported emissions coverage between 2024 and 2025 is primarily due to late reporting companies. These companies are expected to be included in the coverage in the first quarter of 2026, potentially increasing the reported coverage levels by an additional 2 to 4 percentage points (based on past experience).
Looking at the five-year data, the overall trend reflects growing transparency across corporate issuers, with a net improvement of 12 percentage points in reported emissions coverage since 2021.
PCAF Quality Scores across Key Sectors
PCAF data quality scores offer a valuable lens to assess the quality of emissions data. This analysis compares emissions data verification quality between Europe and North America across four high-emitting sectors: Energy, Industrials, Materials, and Utilities.
In Figure 2, company disclosures are categorized using PCAF quality scores. Score 1 (PCAF 1) indicates that companies disclose self-reported and third-party verified emissions data. Score 2 (PCAF 2) indicates that companies disclose self-reported and unverified data.
Figure 2: Average PCAF Quality Scores of Emissions Data for Europe and North America, 2021-2025
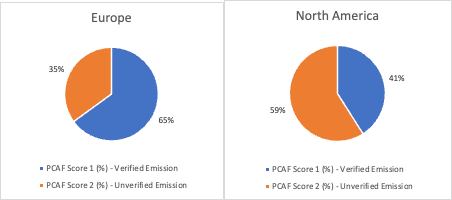
Source: ISS STOXX
Analysis of Scope 1 and Scope 2 emissions disclosure quality across developed-market companies reveals a clear and consistent pattern: European companies demonstrate significantly stronger third-party verification practices than their North American counterparts. Approximately 65% of European reporting companies’ disclosures are classified under the PCAF 1 category, compared with only 41% in North America.
The sector-level heat maps in Figure 3 further reinforce this regional disparity. In the highest-emitting sectors—Energy, Industrials, Materials, and Utilities—European companies consistently report a greater proportion of independently verified emissions.
Figure 3: PCAF Quality Score of Emissions Data in High-Emitting Sectors
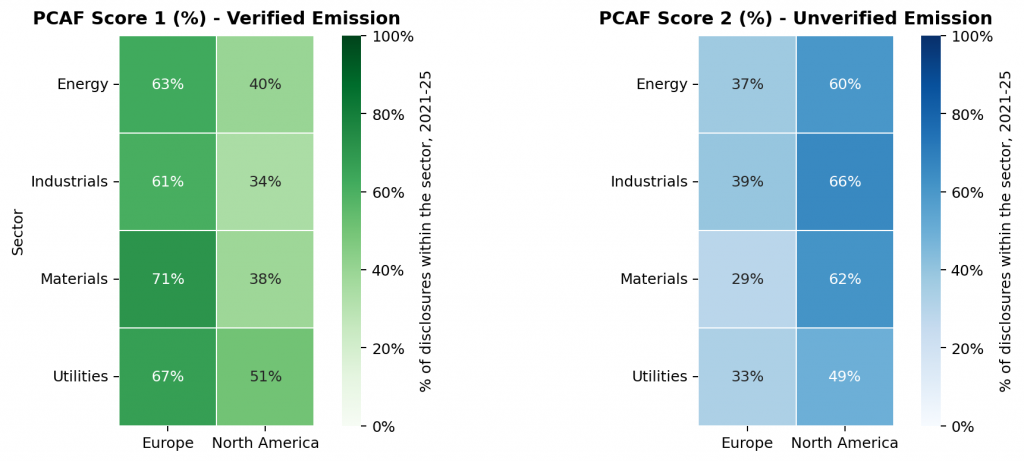
Source: ISS STOXX
The sectoral breakdown further highlights the magnitude of this disparity. The Materials sector exhibits the widest gap in verification rates, with 71% of European disclosures having verified emissions compared with just 38% of North American disclosures. Industrials and Energy show similarly pronounced differences, reinforcing Europe’s stronger and more widespread adoption of external assurance practices across high‑emitting sectors. By contrast, North American companies continue to rely more heavily on unverified emissions disclosures across all sectors.
Overall, analysis of 4,657 disclosures for companies in Europe and 4,462 disclosures for companies in North America show that a higher proportion of Europe-based issuers disclose emissions data than North American issuers. The findings above collectively indicate that emissions data for Europe-based issuers is also more reliably verified. In contrast, North American issuers—particularly within the Materials and Industrials sectors—demonstrate substantial scope to enhance the robustness of their emissions reporting through greater use of independent verification.
PCAF Quality Score Analysis across Key Sectors in Developed and Developing Markets
This analysis examines companies with verified (PCAF 1) and unverified (PCAF 2) emissions over five years (2021-2025) in developed and developing markets to assess disclosure quality and the adoption of verified reporting in four high-emitting sectors: Energy, Industrials, Materials, and Utilities. While emissions reporting has increased across all regions from 2021 to 2025, the pace and consistency of verification varied between developed and developing markets.
Figure 4: PCAF Score Count in Developed and Developing Markets
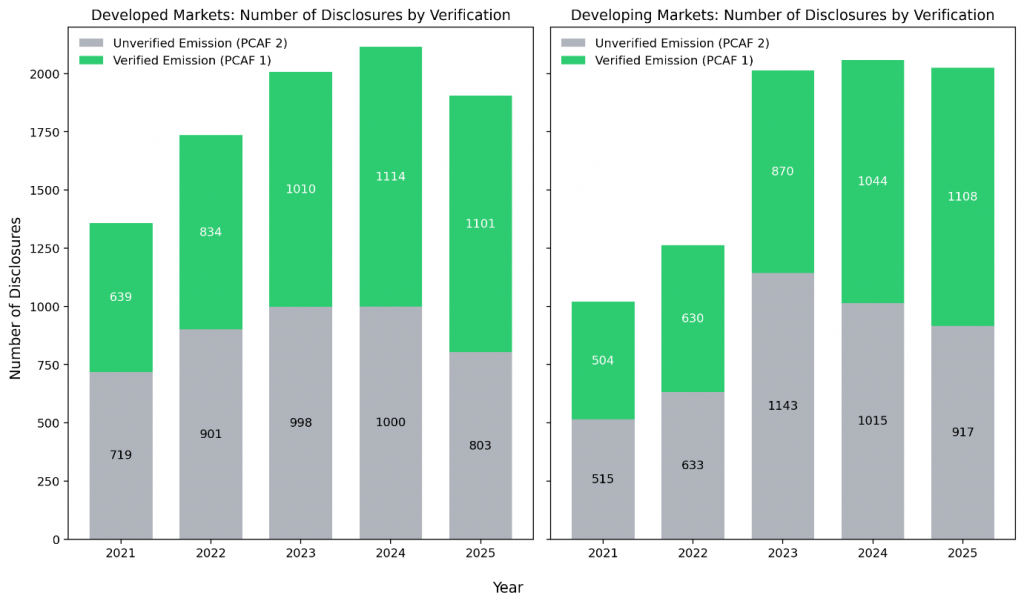
Developed markets exhibit a steady and sustained improvement in verification quality over time. The share of verified disclosures increased from 47% in 2021 to nearly 58% by 2025, with the most pronounced gains occurring in the final two years of the period.
This upward trajectory reflects the combined impact of strengthening regulatory requirements and growing issuer confidence in third‑party assurance. By 2025, for every 100 companies which reported non-verified emissions, 137 companies reported verified emissions, signalling a clear shift toward higher‑confidence and more reliable emissions reporting.
Developing markets also made progress, though with greater fluctuations over time. Verification rates were around 49–50% in 2021–2022. This put developing markets slightly ahead of developed markets at that stage, although significantly lower numbers of total disclosures were reported in developing markets as compared to developed markets. In 2023, the verification rate dropped to roughly 43%, driven by a rise in unverified disclosures reflecting an increase in issuer coverage and evolving regulatory environments. Conditions improved in 2024, with verification rising above 50%, and were strengthened further in 2025 to around 55%. The verified to unverified ratio reached 1.21 in 2025, indicating substantial improvement, although developing markets still lag behind developed markets.
Overall, both developed and developing markets increased their reliance on verified emissions reporting between 2021 and 2025. Developed markets progressed in a consistent, year‑on‑year manner, while developing markets advanced more unevenly but demonstrated a strong recovery following the 2023 decline. By 2025, developing markets had narrowed the verification gap, though overall verification levels remain modestly lower than in developed markets, underscoring the continued opportunity to enhance disclosure quality and assurance practices.
Sectoral Analysis
This analysis compares verified emissions reporting (PCAF 1) across Energy, Industrials, Materials, and Utilities for companies in developed and developing markets from 2021 to 2025. Heatmaps (Figure 5) highlight year-over-year progress, sector differences, and convergence, while noting that developed markets’ larger reporting base drives greater global influence.
Figure 5: A Comparative Heatmap of PCAF 1 in Key Industries
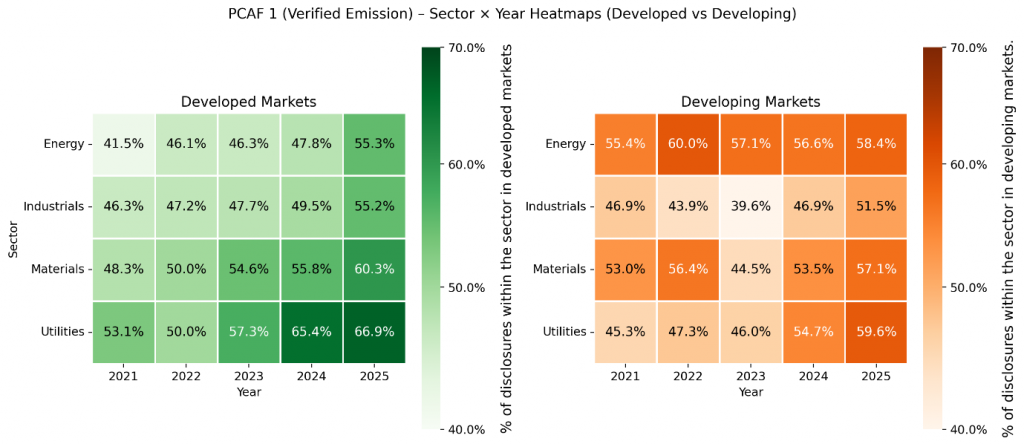
Note: The graphs cover 9,119 disclosures for companies in developed markets and 8,379 disclosures for companies in developing markets, over the five-year period of 2021-2025.
Source: ISS STOXX
The sectoral analysis reveals broad improvements in verification across all sectors and regions. The Energy sector emerges as most convergent, owing to a significant rise in verification proportion across all sectors in Developed Markets. Developing markets showed highest growth, measured in percentage points, in the Utilities sector, and the Energy & Utilities sectors have the highest growth in percentage points in the developed markets. Despite continued progress in both regions, developed markets retain a more stable and reliable verification profile across sectors, including a larger number of companies that report.
Conclusion
Overall, the analysis shows that while emissions disclosure has expanded significantly, data credibility remains uneven across regions and sectors. European and other developed‑market issuers, particularly in high‑impact industries, continue to lead in third‑party verification, which reinforces the reliability of reported emissions. However, developing markets are narrowing the gap as verification practices improve.
For investors, these patterns highlight the availability of verified emissions disclosure across key sectors and may prove critical to transforming climate disclosures into trusted, decision‑useful insights for global capital markets.
By:
Sartaj Khan, Climate Research & Analytics, ISS STOXX
Mo Nasit, Climate Research & Analytics, ISS STOXX