“Strive not to be a success, but rather to be of value.” – Albert Einstein
Try practicing this as a fund manager, Albert. Fund managers are judged on success, as in performance, are they not? And does a fund’s value not lie in how it is positioned within a portfolio to achieve an investor’s objective? The challenge with value when it comes to funds, is that so much of the value generated through the investment process likely occurs outside the fund itself. Be it asset allocation or behavioural coaching—while a fund’s performance gets all the headlines, these more mundane investing actions executed outside of the fund manager’s sphere of influence (either by investors themselves or with the assistance of their advisors) are what determine much of the ultimate investor outcome. Judging the value of funds reductively, may therefore be very challenging indeed.
Nonetheless, defining and more importantly justifying a fund’s value has become modus operandi for fund managers in the UK under the Financial Conduct Authority’s (FCA) Assessment of Value (AoV) regime. The assessment obliges fund managers to consider not simply the performance of their funds, but whether their funds, and their individual share classes, deliver value throughout the investment and product management process.
So how can one judge the value of a fund in isolation? Well, one logical answer would be to question whether a fund delivers, at a justified price, on its investment objective. Answering this question generally involves benchmarking a fund against its peers, introducing the challenge of adequately defining peers. Are they funds of the same IA Sector, same investment objective, similar active/passive tilt or can theoretically achieve the same client objective? All the above plus only where share class investor type matches? And what metric is being benchmarked, return, risk-adjusted return, ongoing charge figure (OCF) and/or the components of the OCF?
Given the subjectiveness of the term ”peer”, it may not be surprising that there is not perfect uniformity in the peer groups used in the AoV reports released today. There is, however, a general consensus on the need for peer benchmarking, particularly with regards to cost and performance—a consensus that puts data front and centre. It is in relation to this that ISS Market Intelligence (MI) is excited to announce our addition of UK Fee and Expense data to Simfund platform.
Pairing this new dataset with Simfund’s existing rich dataset now allows users to a paint a better picture of how assets under management and flows are tracking alongside return and cost. To get the industry’s creative juices flowing, we have leveraged this new data to produce insights illuminating the differences in value narratives between active and passive funds. Please see the note at the end of the article for more on the methodology, including the peer groups, used for the analysis.
The Active and Passive Narratives
Talk performance to win the active narrative. Talk cost to win the passive narrative. These are the narratives that pop out when looking at how assets under management (AUM) and net flows aligned with a fund’s ranking by performance and cost.
Tables 1 – 4 highlight how active funds’ AUM and 12-month trailing flows align to cost, measured by the ongoing fund charge, and performance[1], measured by share class total return.
For active funds, the data shows a bias towards investment performance in terms of a fund collecting more assets and experiencing stronger flows. For example, funds that had first or second quartile performance, defined by the higher performing column in the below chart, accounted for 62.6% of assets and had outflows of £9bn. Conversely, active funds in the lower-cost band, having an OCF in the first or second quartile, accounted for only 51.9% of assets and had outflows of £16bn. The same calculations can be performed for relatively higher cost and lower-performing funds, with the data signaling that active funds with weaker relative investment returns had the rougher ride compared to funds with relatively higher costs. This snapshot supports the idea that active management’s core value anchor is performance excellence. Cost appears to be a secondary consideration. Tables 3 and 4 use the Sharpe ratio as a proxy for performance. The results do not substantially differ from the investment return tables.
Table 1: AUM of active funds by cost and investment return percentiles (March 2023)
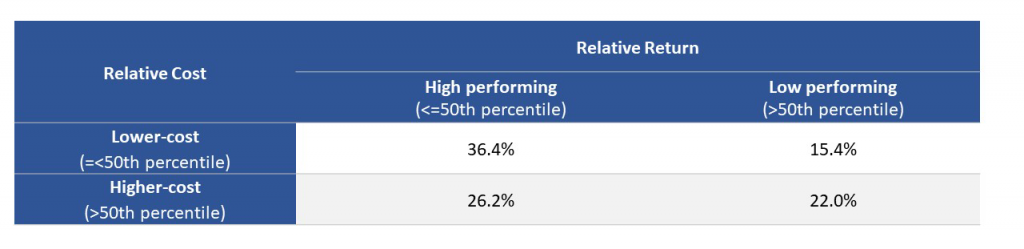
Source: Simfund, ISS Market Intelligence
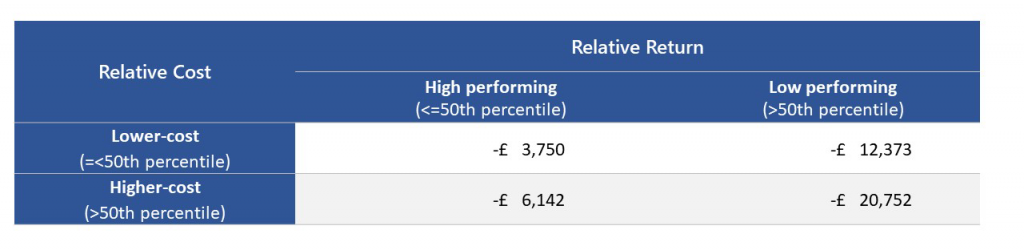
Table 2: 12-month trailing net flows for active funds by cost and investment return percentiles (March 2023)
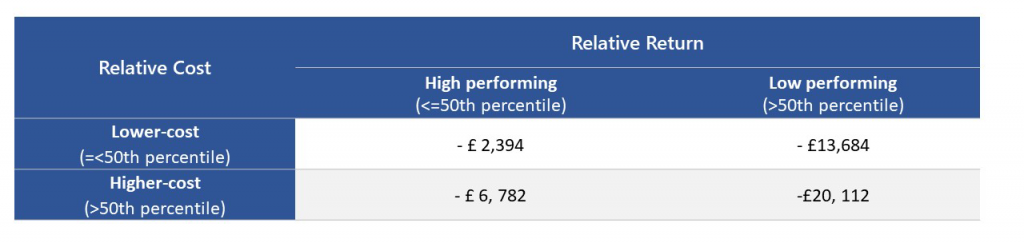
Source: Simfund, ISS Market Intelligence
Table 3: AUM of active funds by cost and Sharpe ratio percentiles (March 2023)
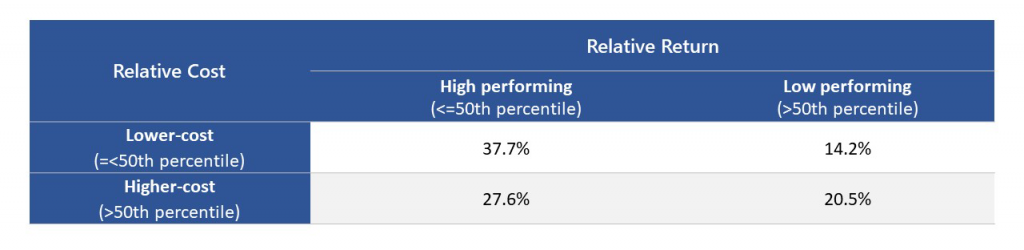
Source: Simfund, ISS Market Intelligence
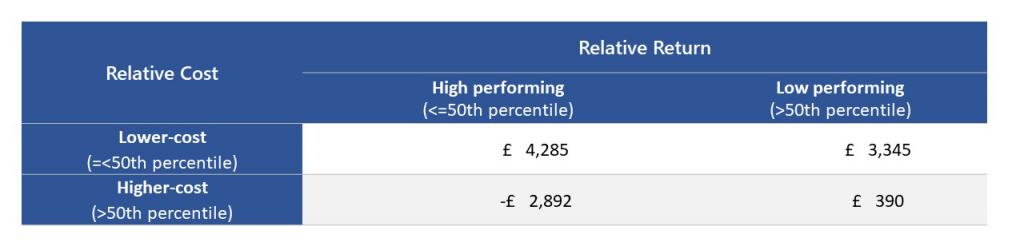
Table 4: 12-month trailing net flows for active funds by cost and Sharpe ratio percentiles (March 2023)
Source: Simfund, ISS Market Intelligence
For passive funds, as shown in tables 5 – 8, the data signals that cost may be the more important criteria for fund success. It is worth noting though that for passive funds, cost and performance are tightly wound, as any cost differences between two index tracking funds would dictate the performance winner, all else being equal. Cost and performance are therefore quite dependent. However, not all passive funds, and tracking methods are created equal. Nor do passive funds all use the same index within an IA Sector. With all that said, lower-cost passive funds had a larger share of assets, 61.3% to 55.8%, and stronger flows, £7.6bn to £1.5bn, compared to higher-performing passive funds. Similarly, higher-cost passive funds performed worse on both metrics compared to lower-performing passive funds. As with active funds, substituting the Sharpe ratio for investment return did not meaningful change the results.
Table 5: AUM of passive funds by cost and investment return percentiles (March 2023)
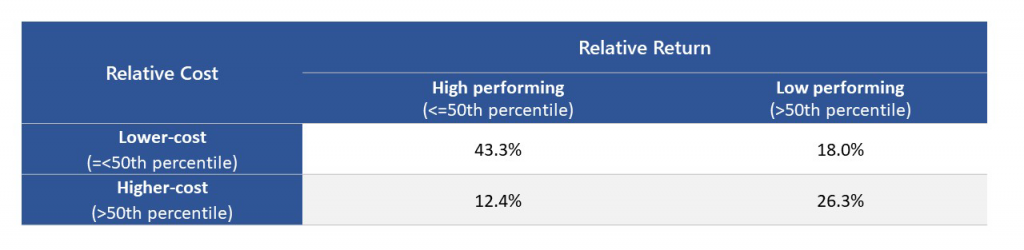
Source: Simfund, ISS Market Intelligence
Table 6: 12-month trailing net flows for passive funds by cost and investment return percentiles (March 2023)

Source: Simfund, ISS Market Intelligence
Table 7: AUM of passive funds by cost and Sharpe ratio percentiles (March 2023)
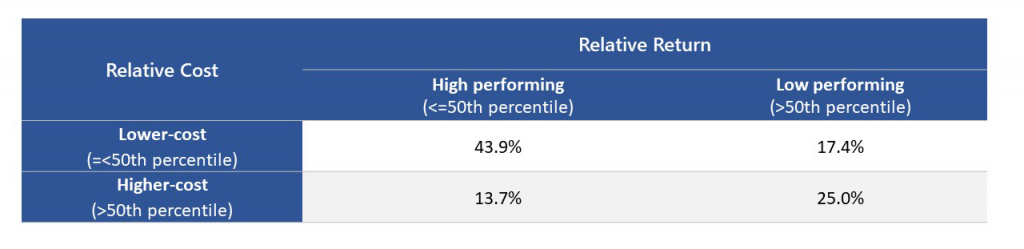
Source: Simfund, ISS Market Intelligence
Table 8: 12-month trailing net flows for passive funds by cost and Sharpe ratio percentiles (March 2023)
Source: Simfund, ISS Market Intelligence
Play to the narratives everyone knows
Aesops fables may be thousands of years old, yet they have retained their relevance. Some narratives are not bound by time and geography. Fund managers may want to consider if the same is true for active and passive narratives. The initial analysis of our fee and expense data highlights that fund managers are likely best to play off the strengths of what active (relative performance) and passive (relative cost) funds can offer. This is not to say that all fund stories over the past 12-months were dictated purely by performance and cost. There were still stories of funds succeeding that had neither strong relative performance nor strong cost credentials. Brand matters too. The data, however, hints that it may be a risky proposition to count on these immeasurables to see funds through challenging times. Easy fixes may also not exist, especially for active funds. Unlike with passive funds, the evidence does not point towards fee cuts, particularly minor ones, being an effective remedy for an unloved fund. In those instances, strengthening the performance narrative of a fund may be the higher-reward, and higher-risk, change required. And this generally involves a change of manager. Not an action without its own consequences.
So are we any closer to answering the question of a fund’s value? The answer is sadly no (the fund business is notoriously complex with many moving parts contributing to the relative sales success—or lack thereof—but that is a story for another article).
Nonetheless, we can dig into fund flow data to understand how investors and their advisors may be defining value—and the answer may well lie along traditional perspectives of active and passive investing. Simfund’s data can also help us understand the question of value in different contexts. Up next, we will examine the question of fund size, and does the much postulated “size discount” exist en masse.
Methodology:
- Peer groups, and thereby percentiles, were created at the share class level with share classes grouped by distributor type, IA Sector and active/passive.
- The total investment return and Sharpe ratio percentiles were based on the age of the funds. For share classes with less than 3-years of history, the 1-year percentile was used, for share classes with less than 5-years history, the 3-year percentile was used, and for all other share classes the 5-year percentile was used.
- Share classes with a distributor type of unknown or internal were removed from the sample.
- Share classes in the Unclassified IA Sector were removed.
- Only peer groups with more than 8 share classes appearing were used in the analysis.
- Only UK-domiciled funds share classes older than 1-year were included in the analysis.
- Source Tables 1-8 : Simfund, ISS Market Intelligence, March 2023
[1] Performance percentiles were based on a fund’s 1-, 3- or 5-year total return or Sharpe ratio, depending on the age of the fund. For more information see the methodology notes at the end of the insight.
Talk to us today to learn more about how ISS Market Intelligence can help your business.
By: Benjamin Reed-Hurwitz, Vice President, EMEA Research Leader ISS Market Intelligence