In order to reduce emissions in a transparent and accountable fashion, they must first be measured and disclosed. For the financial sector, this task is not a simple one. Prior to the emergence of a globally recognised Greenhouse Gas (GHG) Accounting standard, a range of approaches and methodologies were used to measure financed emissions (those associated with loans and investments), leading to inconsistent and non-comparable reporting, as well as a lack of accountability within the sector.
In light of this challenge, in 2015 a range of financial institutions joined forces to establish the Partnership for Carbon Accounting Financials (PCAF). With a growing and increasingly global membership base, PCAF members sought to work collaboratively to develop and implement a standardised approach to measuring financed emissions – and in turn to increase the number of financial institutions committed to reporting these emissions.
In 2020, PCAF published the Global GHG Accounting and Reporting Standard for the Financial Industry, an open-source accounting methodology reflecting months of industry collaboration and consultation and representing a significant step forward for emissions reduction within the sector. The standard provides detailed methodological guidance for six asset classes:
Figure 1: Overview of the six asset classes
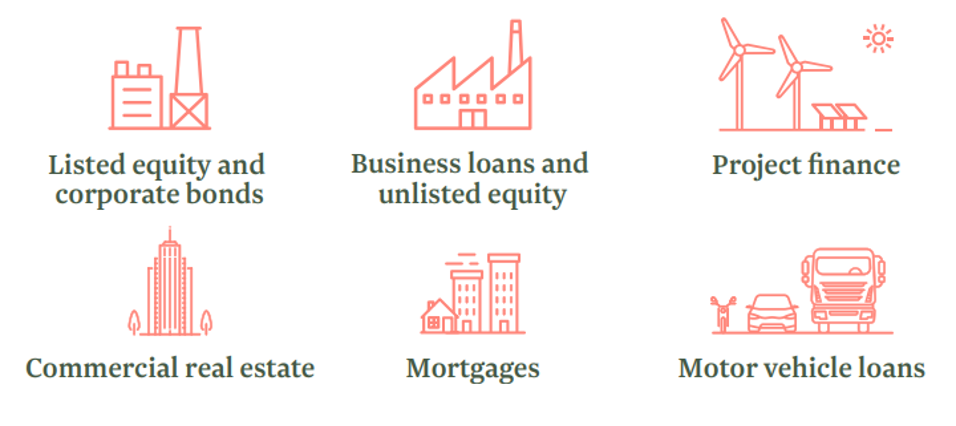
Source: PCAF
Prompted by the increased uptake of its methodology by financial institutions across the globe, PCAF notes that “regulators and other actors consider PCAF as the standard for accounting and disclosing the climate impact of portfolios.” These actors include the Task Force on Climate Related Financial Disclosures (TCFD), which recommends that financial institutions employ PCAF methodologies when reporting financed emissions.
The Role of Sovereign Bonds
Sovereign bonds are an important component of most mainstream investment portfolios, representing more than $60 trillion globally. However, due to their characteristics, these securities pose additional challenges in terms of emissions allocation and attribution.
Since the onset of reporting sovereign emissions – a legacy of Articles 4 and 12 of the UNFCCC and the decisions of the Conference of the Parties – Annex I countries are required to provide national GHG inventories covering all gases outlined in the Kyoto Protocol for key sectors (i.e.: Energy; Industrial processes; Agriculture; Waste; Land use, land-use change and forestry (LULUCF); and Other). These emissions are commonly referred to as “Production Emissions,” including emissions produced within the country’s jurisdiction.
In November 2021, PCAF published a draft guidance for emissions accounting of sovereign bonds, identifying two possible accounting approaches seeking to mirror the GHG Protocol categories of Scope 1, 2, and 3. These are the Territorial Approach and the Government Approach, as shown in Figure 2 below. In addition to the existing category of Production Emissions, these methodologies encompass consumption emissions (those derived from imported goods), to reflect the demand side of sovereign energy consumption. This provides, according to PCAF, “a more holistic assessment of a sovereign’s carbon emissions and for engagement with sovereigns.” As the guidelines are finalized, financial institutions can expect to receive more insight regarding the inclusion of import and export-related emissions.
Figure 2: Overview of the two approaches proposed by PCAF
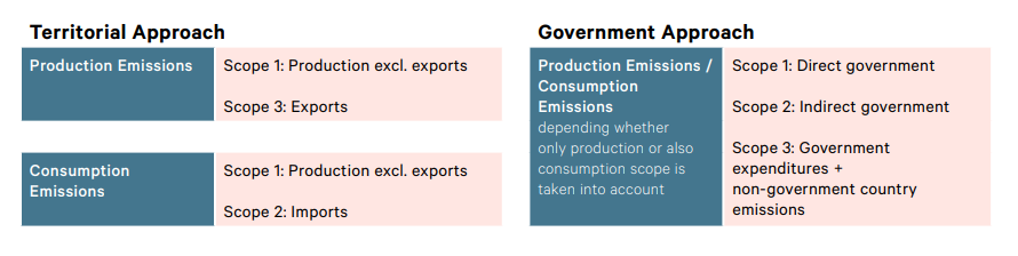
Source: PCAF
For further detail on the proposed methodologies, see PCAF’s draft new methods for public consultation.
Sub-National Bonds: Developing an Assessment Methodology
While methodologies for sovereign emissions accounting are already under consideration (largely facilitated by the existing dataset required by the UNFCCC), the matter of sub-sovereign accounting remains largely unaddressed. Within the Australian market, sub-national bonds (locally referred to as semi-national bonds, or ‘semis’) comprise a significant proportion of fixed income issuance.
Australian banks are required by regulators to maintain a certain quantity of high-quality liquid assets, which include Australian Government Securities (sovereign bonds, henceforth AGS) and semis. Among superannuation investors, the Australian fixed income allocation is approximately 13%, with a specified allocation to AGS as well as semis and corporate bonds. Moreover, the most commonly used benchmark index for Australian fund managers, the Ausbond Composite 0Y+ index, is comprised of ~50% AGS and semis.
Within its draft guidance addressing sovereign bonds, PCAF notes the following:
It is challenging to extend the accounting standard to sub-sovereign and municipal counterparties due to very limited data availability and because these counterparties are not directly subject to international GHG emissions inventory standards (e.g., by the United Nations Framework Convention on Climate Change [UNFCCC]). Therefore, these counterparties are not explicitly part of this asset class, but FIs might consider using an approximation approach (e.g., by share of GDP generated by sub-sovereigns) to evaluate the emissions attributable to sub sovereign and municipal counterparties.
In line with this advice, ISS ESG has undertaken a pilot project to calculate the emissions attributable to the 8 Australian states and territories, producing a carbon footprint for each.
Methodological Approach
In this pilot phase, ISS ESG provides the same metrics as for the sovereign dataset, with a sole focus on the eight major Australian states and territories: New South Wales (NSW); Victoria (VIC); Queensland (QLD); South Australia (SA); Western Australia (WA); Tasmania (TAS); Northern Territory (NT); and the Australian Capital Territory (ACT).
The analysis is restricted to these states, as the seven external territories have negligible weights in terms of emissions (0.01%) and macroeconomic factors cannot be retrieved.
Although sub-sovereigns are not subjected to the reporting requirements outlined by the UNFCCC, the Australian Federal Government provides a disaggregation of the national Production Emission estimates at the state level. Within these reported figures, ISS ESG focuses on five sectors (Energy, Industrial processes, Agriculture, Other, and Waste) and excludes LULUCF, as accounting differences between countries can lead to different carbon profiles. This approach is in line with the current methodology for sovereign emissions that ISS ESG offers (for example, Tasmania is already net-zero in terms of emissions when we include LULUCF). As seen below, ISS ESG showcases how the key carbon metrics can be calculated based on a dummy portfolio composed of only Australian state government securities.
Figure 3: Extract of ISS ESG’s sovereign carbon footprint report for a portfolio including sub-sovereign production emissions
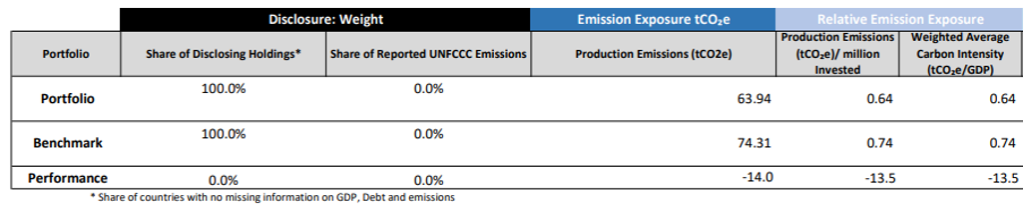
Source: ISS ESG
As Production Emissions are readily available, ISS ESG can derive the state government-attributed emissions by using a proxy that estimates the government’s final consumption expenditure (as a % of the Gross State Product (GSP)). The use of government total expenditure provides an estimation of the direct and indirect central government emissions for the different Australian states and is applied to the Production Emissions. The aggregation of state and territory government emissions is ~17% lower than the emissions attributed to Australia, as state emissions primarily consider financing and expenditures at the state level, without incorporating Commonwealth government expenditures.
For transition risk metrics, ISS ESG provides the historical 5-year energy mix at the state level, calculated using data from the federal Department of Industry, Science, Energy and Resources (DISER).
Figure 4: Energy Mix: Growth Rate of Fossil Fuel and Renewable Energy, 2015-2020
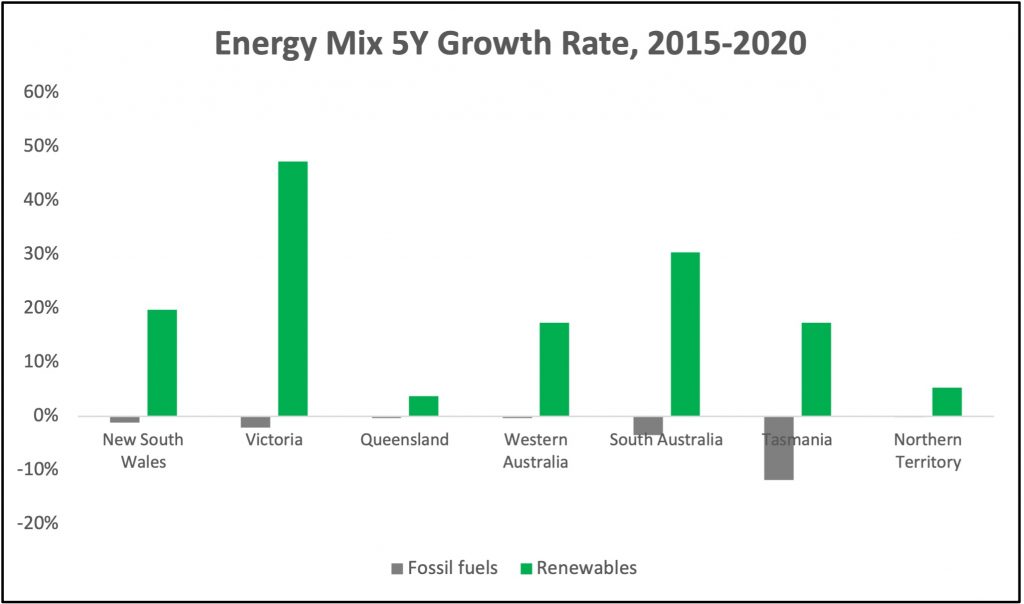
Source: ISS ESG, DISER (ACT energy mix aggregated with NSW, as reported by DISER)
Examining the change in energy mix for fossil fuels and renewables over the past five years provides Asset Managers and Asset Owners with insight into each State’s progress towards achieving a low-carbon energy system. Overall, the different states in Australia are slowly increasing their use of renewable energy. For instance, Tasmania is the only state with 50% of its energy derived from renewable sources (+17.40% between 2015-2020), while decreasing its fossil fuel use by 12% over the same period. It is important to note that a higher growth rate does not necessarily reflect a higher proportion of renewables within the energy mix. For example, in 2015, Victoria’s energy mix comprised only 4.25% renewables, growing to 6.25% by 2020, thus generating a five year growth rate of 47.3%.
Another key challenge in the creation of sub-sovereign metrics relates to Australia’s distinct geology in terms of coal, gas, and oil reserves. In 2020, Australia accounted for 14% of global coal reserves, 1.3% of gas reserves, and 0.14% of oil reserves (as calculated by ISS ESG). The primary coal basins and gas fields are not confined within state boundaries, however. The Eromanga Basin, for example, crosses four different states. This makes the attribution of the various fossil fuel reserves/basins to the states and territories more complex.
Figure 5: Black and brown coal basins in Australia (2017)
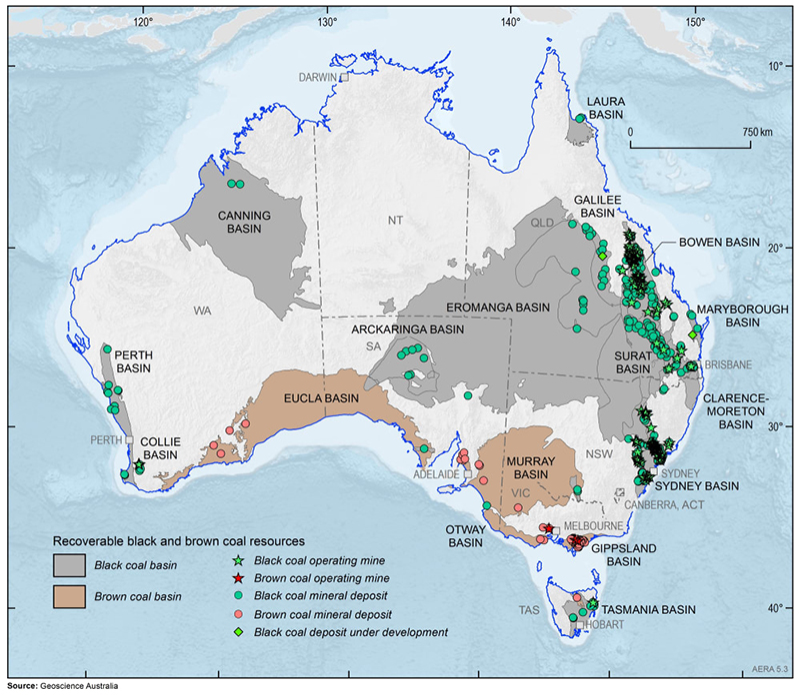
Source: Geoscience Australia
In this context, ISS ESG developed a proxy to derive the state-level reserves by calculating the share of total production of each resource by state, generating a production ratio for each. This percentage is then applied to national reserves of the respective resources, as reported to the International Energy Agency, which provides an estimated proportion of reserves, in physical units, for each state.
There are several limitations within this approach to sub-sovereign emissions calculation. It is important to note that the quality of the output of this analysis is highly dependent on the granularity of the inputs for each state, which should be consistent with our PCAF-aligned sovereign emissions methodology. For example, gross debt at the state level was not publicly available, so ISS ESG excluded the metric to avoid any inaccurate estimations. As pointed out by PCAF, the very limited data availability at the sub-sovereign levels makes it difficult to provide metrics that adequately reflect the carbon profile. As data on emissions at the municipal and sub-sovereign levels becomes more important, data availability is expected to improve. Over time, then, it will become easier to provide metrics tailored to those counterparties.
Beware Double Counting
Within both sovereign and sub-sovereign emissions accounting, there is a key methodological issue preventing investors from combining these emissions figures with corporate emissions where various asset classes are included in one portfolio. This issue, as one may expect, is that of double counting.
Firstly, sub-sovereign emissions are included within sovereign emissions of the same country. Should a portfolio include, for example, both AGS and semis, adding both within the same carbon footprint will naturally lead to some emissions being counted twice. By the same token, neither sovereign nor sub-sovereign emissions can soundly be included in a carbon footprint which also includes corporates. For example, if a portfolio is invested in both AGS and Australian corporate securities, the corporate emissions will also be counted in the sovereign emissions.
In addition, the denominators used to calculate emissions intensity differ between corporate and sovereign securities, with corporates using either market capitalisation or Enterprise Value Including Cash (EVIC), and sovereigns using either debt or GDP. A combined intensity metric is therefore not possible, while an absolute carbon footprint precludes the possibility of comparison.
For these reasons, PCAF advises that these asset classes be reported separately, while emphasising that “accounting for all emissions indirectly involved with loans and investments of the different individual asset classes does ensure that the right considerations are taken when making lending or investment decisions.”
Conclusion
Fixed income securities comprise a significant proportion of global investment markets, and as investors worldwide become more aware of the implications of climate risk for their long-term returns, attention is turning to this oft-neglected portion of their portfolios.
While standards exist to measure the climate performance of sovereign bonds, to date challenges around data availability have restricted the extension of this analysis to sub-sovereign debt.
The ISS ESG Climate Solutions team have piloted a novel approach that allows this data to be gathered from publicly available sources, allowing for a comparison of the carbon performance of Australian states.
This analysis shows that while many states are showing an impressive increase in the share of renewables generated, this is usually from a low base. The more important measurement of reductions in fossil fuel use shows little movement in most states, with the exceptions of Tasmania and South Australia.
There are limitations to these forms of calculation, with the risk of double counting chief amongst them. Nevertheless, this analysis demonstrates the feasibility of applying climate performance data to the sub-sovereign debt portion of investor portfolios, with all the benefits that flow from this in terms of managing portfolio climate risk and engaging with issuers.
Explore ISS ESG solutions mentioned in this report:
- Use ISS ESG Climate Solutions to help you gain a better understanding of your exposure to climate-related risks and use the insights to safeguard your investment portfolios.
By: Emily Faithfull, Climate Analytics Consultant, ISS ESG. Apolline Foucher, Climate Analytics Consultant, ISS ESG