Navigating global crosscurrents, total assets under management (AUM) in sustainable funds grew at high single-digit rates in 2024. Nevertheless, these growth rates represented a meaningful slowdown compared with prior years. The sustainable ETF category, which is 91% index-based, grew a healthy 19%, which was still below the growth in conventional ETFs. This report, a follow-up to the 2023 review of sustainable funds, examines 2024 trends in the sustainability category based on data from ISS MI MarketPulse.
Regulatory, economic, and investor preferences reveal a mixed picture for sustainable fund assets and flows in 2024. While sustainable assets grew by 9% and net flows remained positive at about 2% of prior-year assets, this growth was lower than that of conventional funds for the first time in at least five years. Europe and North America, which jointly account for approximately 97% of sustainable fund assets, show contrasting trends. In addition, ETFs (20% of sustainable fund assets) remain the relative bright spot, with more robust growth reflecting the appeal of index-based sustainable strategies. This analysis focuses on the overall equity and fixed income funds categories, which totaled $49.7 trillion in total AUM globally as of December 2024.
The distinction between sustainable and conventional funds relies upon the Morningstar classification available on MarketPulse. “Unclassified” funds are included within the conventional category. Based on this definition, there are $46.9 trillion in conventional funds and ETFs while $2.8 trillion are in sustainable funds and ETFs, as shown on Table 1. Drilling down, the majority of sustainable AUM, around 85%, is domiciled in Europe (including “International funds”).
Table 1: Mutual Fund and ETF AUM by Fund Type (Dec 2024, trillion $)
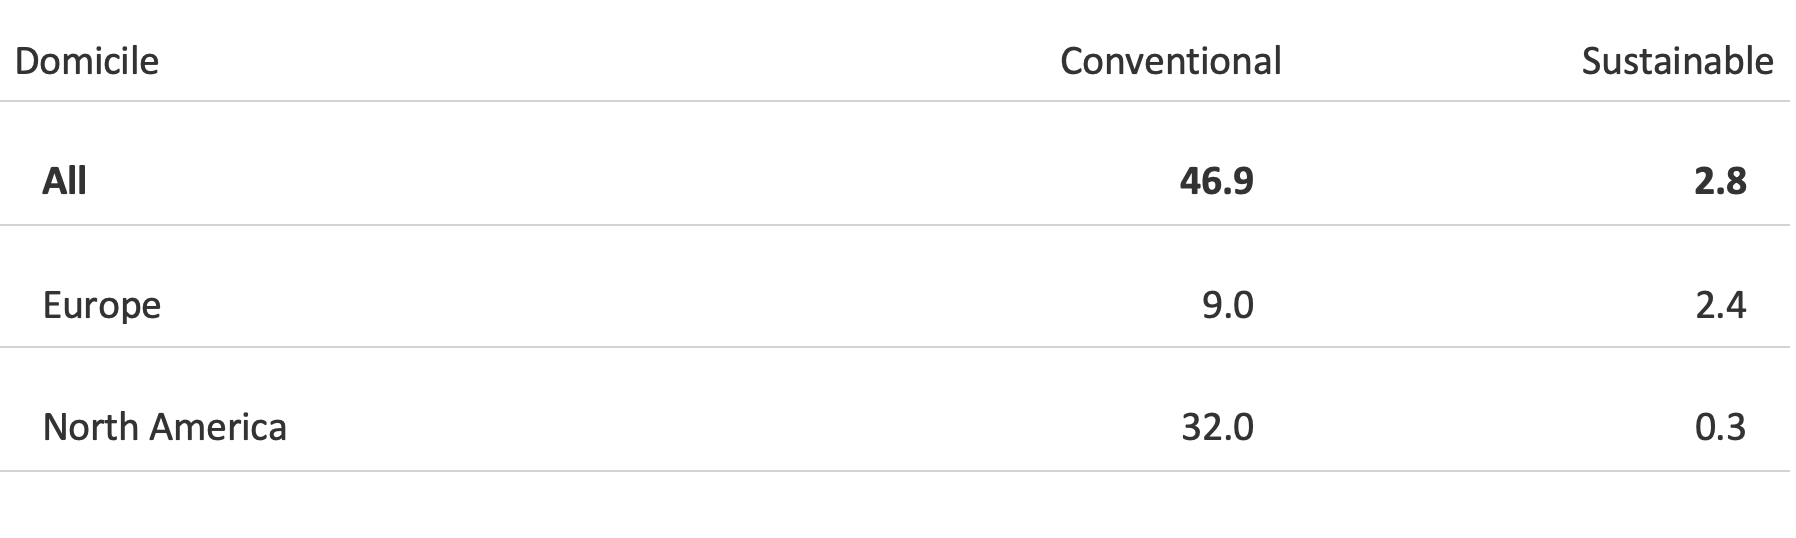
Source: ISS MI MarketPulse
Examining 2024 AUM growth shows that globally sustainable funds grew 9.4% last year, compared with 14.3% for conventional funds. Growth was quite similar in Europe (9.6% for sustainable vs 10.0% conventional), while in North America conventional funds outgrew sustainable funds (15.2% vs 9.0%), as shown on Figure 1.
Figure 1: 2024 Sustainable and Conventional Funds AUM Growth: Equity and Fixed Income Mutual Funds and ETFs
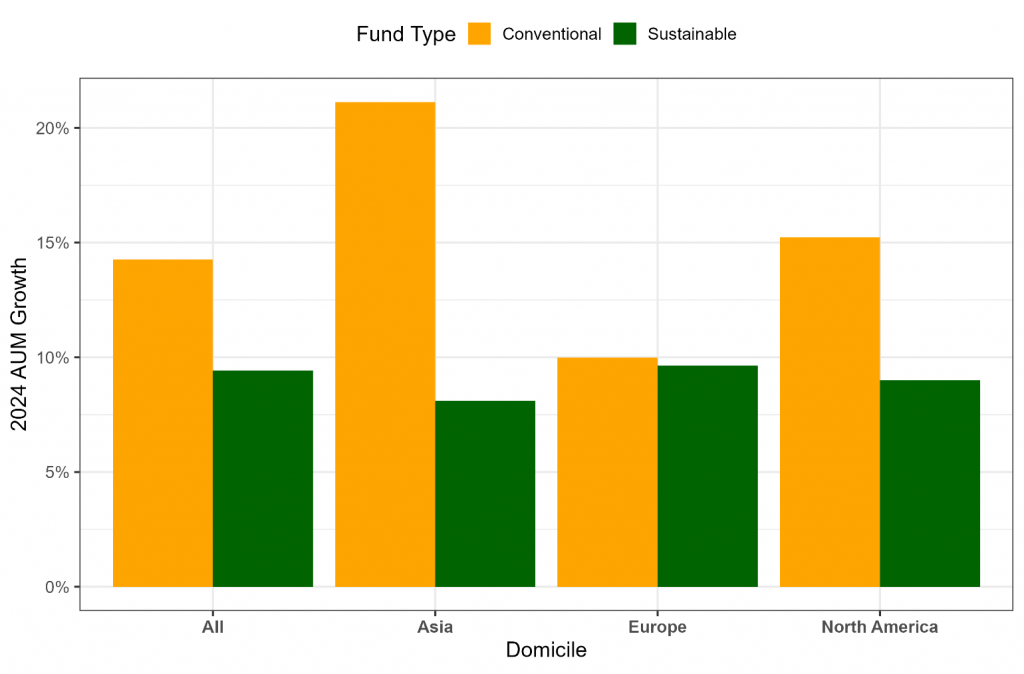
Note: Uncategorized funds included with conventional funds.
Source: ISS MI MarketPulse
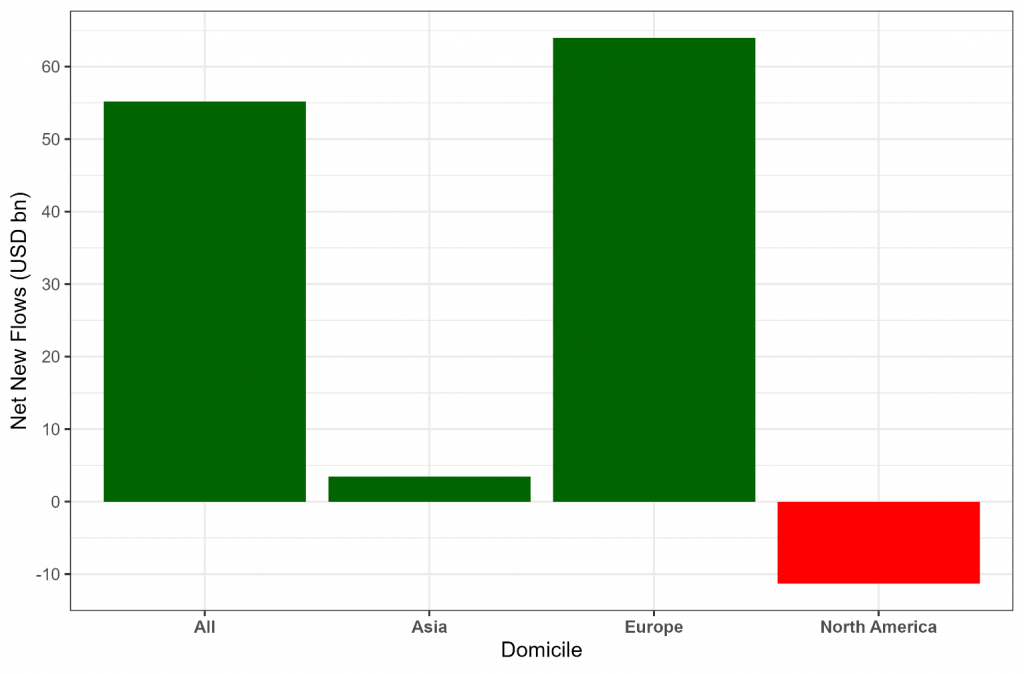
Regarding 2024 net flows into sustainable funds, $55 billion was added globally, led by Europe, which added $64 billion (Figure 2). Europe’s flow in 2024 was approximately two-thirds of its net flow in 2023. In sharp contrast, North America experienced outflows of $11.3 billion, compared with modest inflows in 2023. Of note, within Asia a positive $3 billion in net sustainable flows was recorded. While Asian flows remain relatively modest, 2024’s positive flow represents a reversal of outflows in 2023. Coming from a smaller base, this represents a large percentage increase (49%) for Asia.
Figure 2: 2024 Sustainable Net Flows: Equity and Fixed Income Mutual Funds and ETFs
Source: ISS MI MarketPulse
To compare 2024 sustainable flows with conventional flows, it is helpful to normalize by 2023-end AUM, given the much larger asset base of conventional funds (Figure 3). Globally, sustainable funds had net flows of 2.2% compared with 4.1% for conventional funds. In Europe, sustainable funds underperformed conventional funds 3.0% vs 4.5%, while in North America sustainable funds experienced net outflows of 3.8% vs 2.2% inflows for conventional funds.
Figure 3: 2024 Sustainable and Conventional Net Flows: Equity and Fixed Income Mutual Funds and ETFs
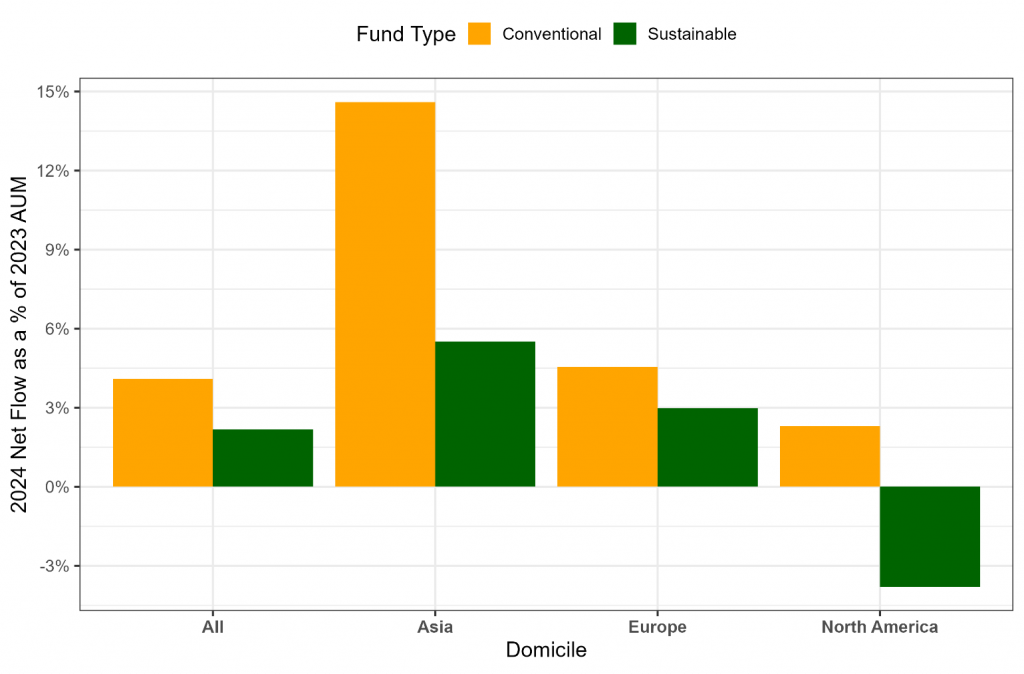
Note: Uncategorized funds included with conventional funds.
Source: ISS MI MarketPulse
As the secular market shift toward Exchange-Trade Funds (ETFs) continues, another valuable perspective on sustainable investing is to focus exclusively on ETFs. Table 2 shows ETF AUM by region, highlighting $0.55 trillion in sustainable ETF assets and $13.1 trillion in conventional assets.
Table 2: ETF AUM by Fund Type (Dec 2024, trillion $)
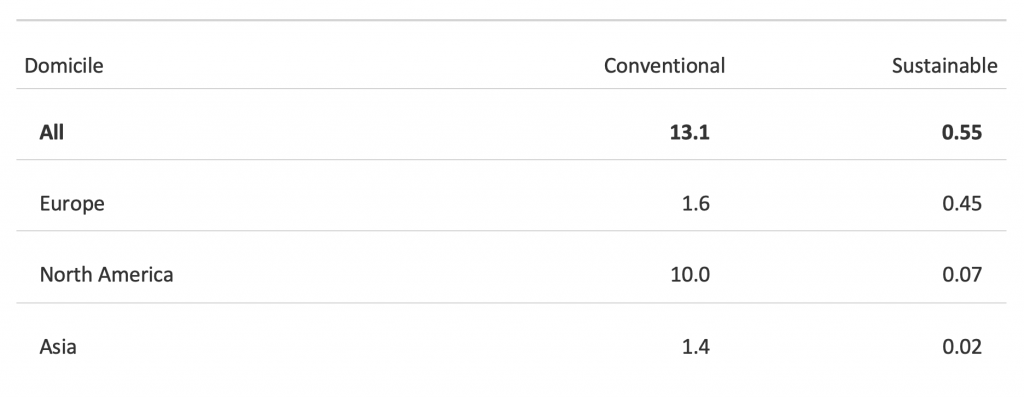
Source: ISS MI MarketPulse
Figure 4 shows the ETF AUM by category. Global 2024 AUM growth for sustainable ETFs was 19.1%, compared with 26.3% for conventional funds. Similar growth rates hold in Europe and North America, although interestingly North America grew more than Europe in 2024 in percentage terms, from a lower base. Asia is the only region in which sustainable ETFs grew faster than conventional ones.
Figure 4: 2024 Sustainable and Conventional ETF AUM Growth: Equity and Fixed Income ETFs
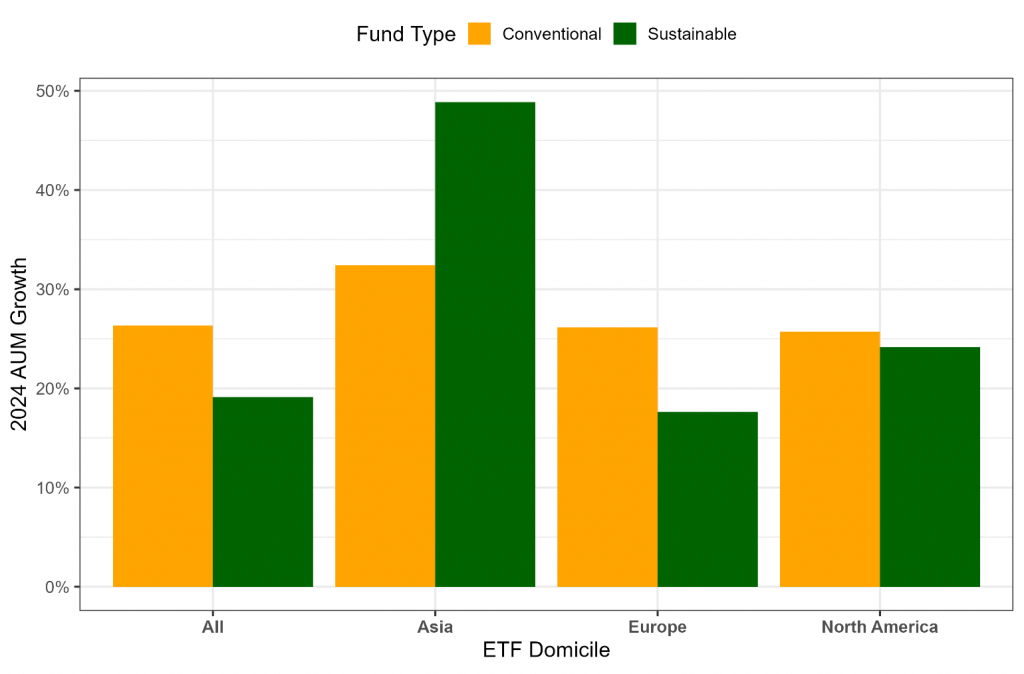
Note: Uncategorized funds included with conventional funds.
Source: ISS MI MarketPulse
Regarding net flows, sustainable ETFs had net flows of $43.5 billion, led by Europe at $29.6 billion and North America at $6.9 billion (Figure 5). In Asia, sustainable ETFs received net flows of $7.6 billion. As a percentage of 2023 AUM, sustainable funds grew by 9.3%, compared with conventional funds at 14.2% (Figure 6). Europe and North America experienced similar growth rates.
Figure 5: 2024 Sustainable ETF Net Flows: Equity and Fixed Income ETFs
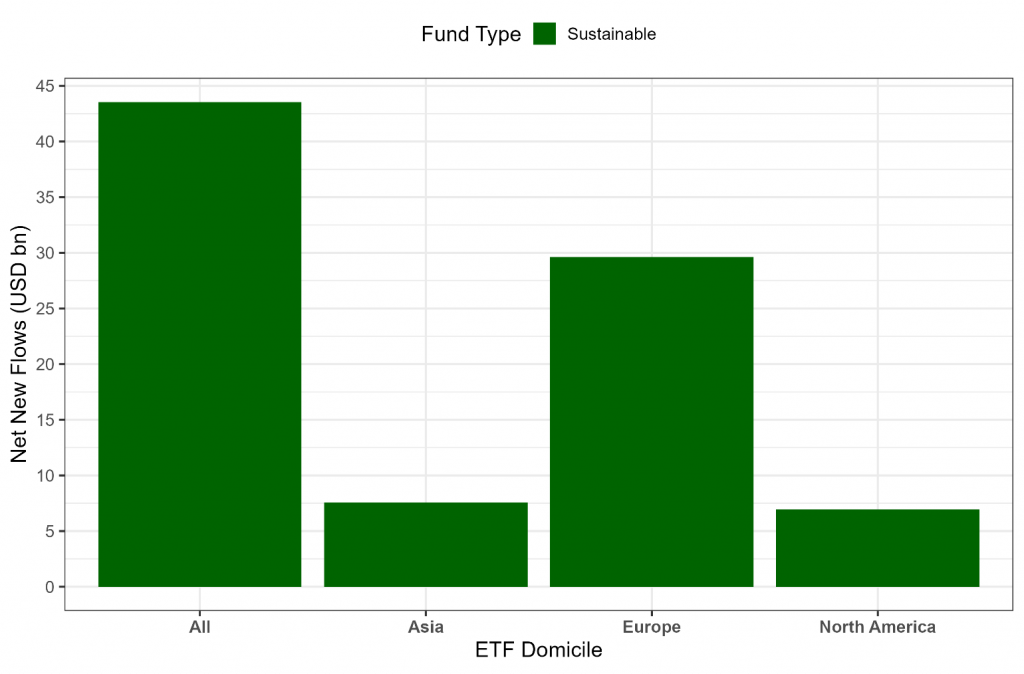
Source: ISS MI MarketPulse
Figure 6: 2024 Sustainable and Conventional ETF Net Flows: Equity and Fixed Income ETFs
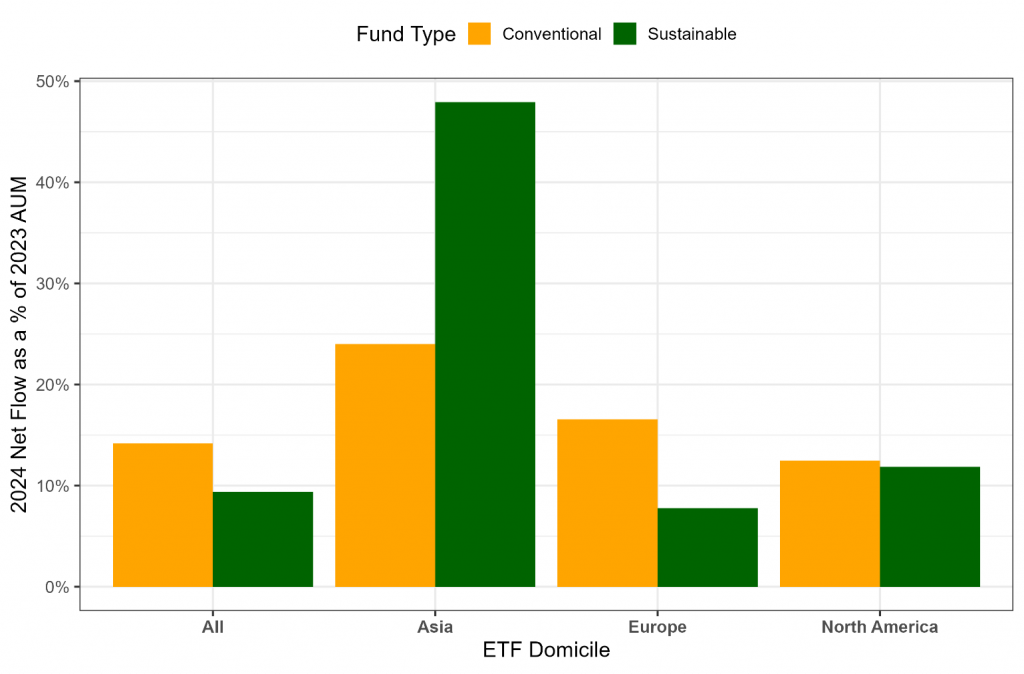
Note: Uncategorized funds included with conventional funds.
Source: ISS MI MarketPulse
Looking exclusively at trends over the past three years, the AUM growth rate in the $555 billion global sustainable ETF market has meaningfully outpaced that of the $15 trillion overall market (Figure 7).
Figure 7: AUM Growth Rate: Sustainable vs All ETFs
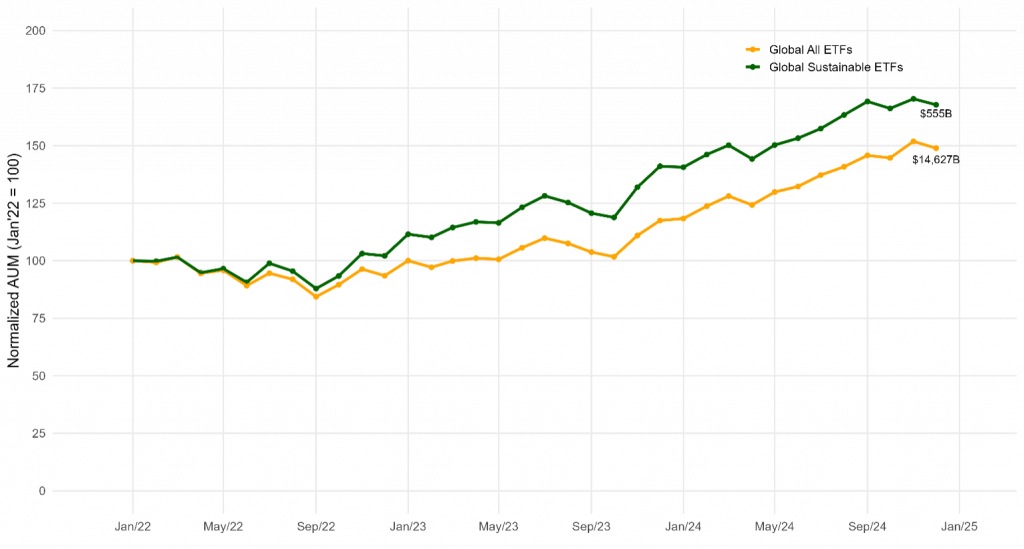
Source: ISS MI MarketPulse
To summarize, asset growth in sustainable funds slowed to 9% in 2024, below the growth in conventional funds. As index-based strategies continued to gain overall share, sustainable ETFs grew a more robust 19% but were still outpaced by conventional ETFs. Regionally, Europe continues to account for most sustainable fund assets, while Asia showed the highest growth in sustainable ETFs of any region (49%), generated from a modest base.
Explore ISS ESG solutions mentioned in this report:
- Quickly and effectively evaluate & benchmark the ESG performance of equity and bond funds globally using the ISS ESG Fund Rating service.
By:
Hernando Cortina, CFA, Managing Director, ISS ESG
Moe Phyu, Senior Associate, ISS ESG