Net Flows Fall to Lowest Level in Years
Stock pickers have their work cut out for them; building a portfolio that can beat the market is difficult and competition among other fund managers in the UK is fierce. Competing against passive funds? That makes their job even more difficult. Passive investors don’t overwork themselves trying to find the right fund that can beat its benchmark, they’d rather pick a passive fund that closely tracks an index of their choice. Yes, it does remove the chances of outperforming the market, but it also removes the risk of underperforming the market. On top of this, passive funds charge significantly lower management fees. Judging by the speed at which the passive investment market has grown over the last decade, many retail investors are more than willing to make this performance-fees trade-off. Particularly when most active funds underperform their passive counterparts in short to long-term horizons.
Not everyone is sold on passive investing though, sceptics have long claimed that active fund managers would prove their worth in times of market uncertainty. We heard this a lot at the beginning of the pandemic too. Supposedly, stock pickers are better able to navigate the turmoil of difficult market conditions and can be more nimble than passive funds. Unfortunately for the passive fund sceptics, it appears as though most active funds failed to meet their benchmarks in 2020 according to research by SPIVA[1]. Now there’s a new challenge though, one that passive funds haven’t faced before, high inflation. The last time that developed economies around the globe experienced high inflation was a long time ago, and the passive investment market was a tiny fraction of its size today. These adverse market conditions seem to have spooked investors a bit as inflow to passive funds via platforms totalled £5.3bn in Q3, down £864m from the previous quarter. This corresponds to a fall of 14.0%, meanwhile, active funds saw inflows fall by 11.6%. If we consider net flows, we see that aggregate sales to passive funds dropped from £1.5bn in Q2 to £601m in Q3. This is the lowest quarterly net flows figure seen since the second quarter of 2018. Meanwhile, net flows to active funds in Q2 totalled £2.62bn and only dropped to £2.61bn in Q3. Passive funds sceptics have certainly won a round in 2021Q3, but will this trend continue? Have we finally seen the appeal of passive funds start to wane?
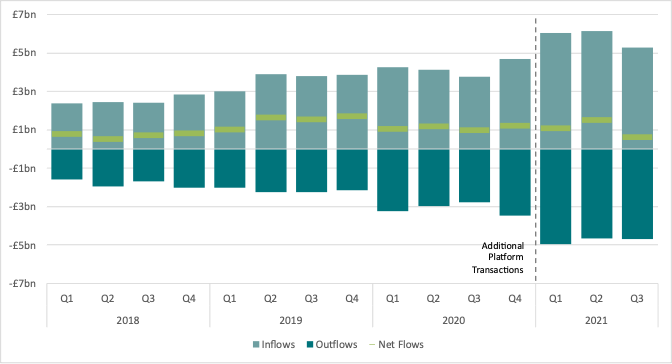
*In Financial Clarity’s Q2 release, we improved the platform channel intermediary level fund flow data from 2021Q1. This change means that platform inflows from Q1 onwards are expected to be higher.
IA North America’s Outflows Reach New Highs
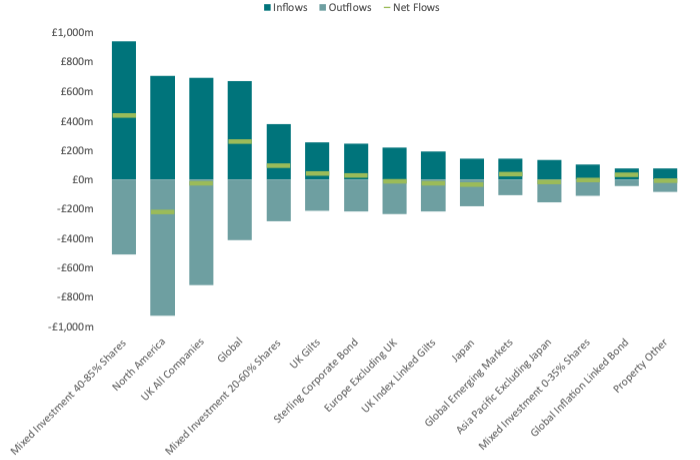
IA Mixed Investment 40-85% Shares extended its lead as the sector with the highest passive inflows in Q3. In the second quarter of the year, inflows to IA North America and IA UK All Companies were both within £160m of the record-setting £944m directed to IA Mixed Investment 40-85%. In Q3 however, these two sectors saw quarterly inflows fall by a combined £315m and as a result, each sector’s inflows were over £230m shy of the leading sector’s inflows. IA Mixed Investment 40-85% Shares is also the sector that saw the highest net flows in Q3 (£437m), followed by IA Global (£260m).
IA UK Gilts and IA North America are the two sectors that saw the greatest decline in inflows relative to Q2, as sales fell by £185m and £195m, respectively. The North American IA sector also saw an increase in outflows in Q3, causing its quarterly net flows to drop by £390m. This cemented the sector as the one with the greatest drop in net flows relative to Q2. After several quarters of strong performance, the 3 months leading up to October was more mixed for US equities. Concerns over high inflation and lower than expected growth in 2021 lead many investors to shy away from US focussed funds. IA Global, meanwhile, was the sector with the greatest increase in inflows and net flows from Q2. This indicates that the appetite among investors for exposure to a globally diversified portfolio of stocks has intensified in the third quarter of the year. The sectors that haven’t done as well out of this trend are the region-specific sectors such as IA North America, and IA UK All Companies.
Every year, we see that more and more investors are choosing to move their savings into passive funds. What we’ve observed is that for some sectors, investors are keener to move away from the actively managed approach than for others. For instance, 40% of inflows to IA Mixed Investment 40-85% Shares are directed to passive funds and 39% of IA North America inflows go into passive funds. Meanwhile, only 17% of inflows to either IA Europe Excluding UK or IA Sterling Corporate Bond are being directed to passive funds within those sectors.
The South West Remains Keen on Passive Investing
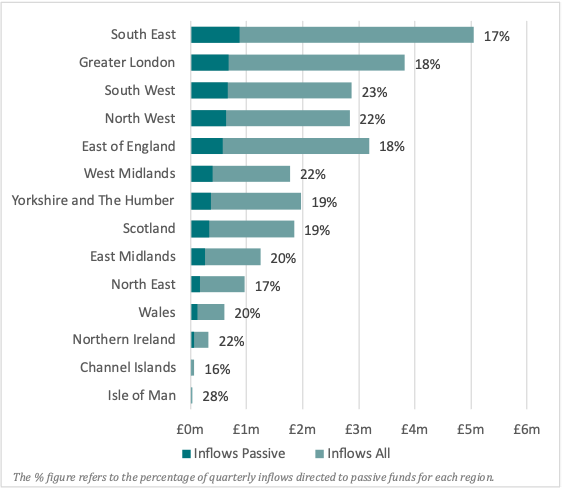
Of the 10 biggest regions in the U.K. by inflows via platforms, the South West continued to be the region that most bought into passive investing, as savers from that part of the country directed over 23% of their inflows to passive funds. From that same set of regions, the two that directed the lowest share of inflows to passive funds were the North East and South East. Both regions invested 17% of their total inflows into passive funds. Interestingly the two smallest regions by total inflows, the Channel Islands, and the Isle of Man, saw the lowest and highest share of their inflows directed to passive funds, respectively. Overall in Q3, for every £1 invested by savers in the UK, 19p is poured into passive funds.
Report Scope
Passive Investment includes onshore, OEICs, SICAVs, ETFs & Unit Trusts’ transactions via UK platforms.
L&P Product Types were excluded. Cofunds’ outflows were estimated for 2018H1.
Some transactions were reported against firms’ headquarters and may distort locations’ authenticity.
Ongoing enhancements to data collection & accuracy may result in slight changes in overall figures compared to previous reports.
[1] SPIVA scorecard is a report produced by S&P Dow Jones Indices comparing actively managed funds and their benchmarks.
By Kevin O’Neill and Fenia Tsikrika, Financial Clarity, ISS MI
