Introduction
Over the past decade, many investors have been asked to measure the climate impact of their financing activities. This analysis explores the trend of company-reported GHG emissions in the Energy and Utilities sectors and offers an initial viewpoint on what this trend implies for investor portfolios.
Reporting Trends
One key element in analyzing greenhouse gas emissions trends over time is the proportion of companies that report their Scope 1+2 emissions. Figure 1 illustrates the trend of Energy and Utilities companies within ISS ESG’s assessment universe reporting their Scope 1+2 emissions over 2017-2022.
Figure 1: Percentages of Companies Reporting Scope 1+2 Emissions in Energy and Utilities Sectors
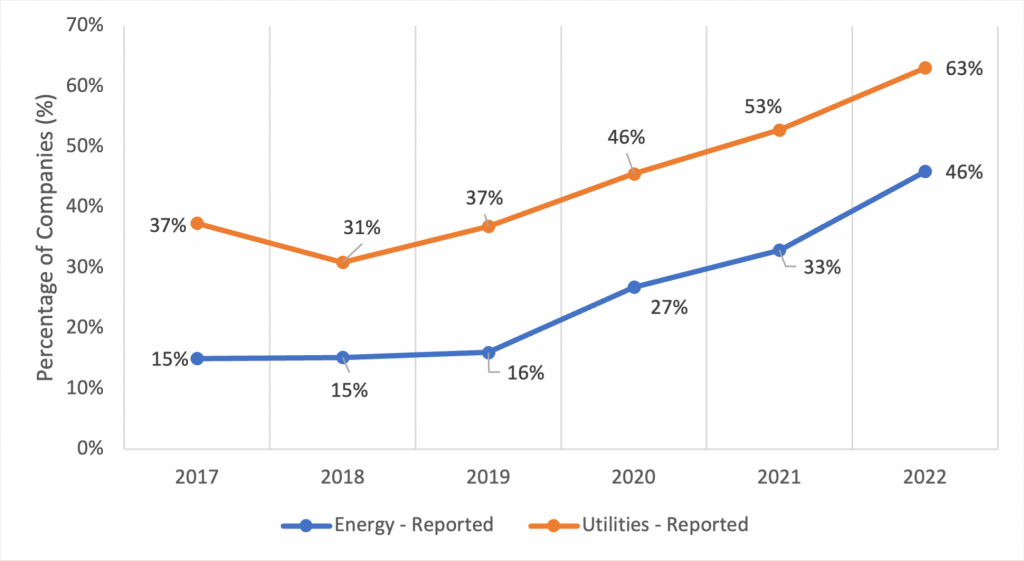
Source: ISS ESG, 2024
The data show that, amongst companies in the Energy sector, the proportion disclosing their Scope 1+2 emissions increased by over 30 percentage points, a large increase in rates of emissions disclosure. For the Utilities sector, a cross point was reached by fiscal year 2021, when most companies began to disclose their emissions.
Emission Trends
As the number of companies reporting their Scope 1+2 emissions has grown over time, the carbon profiles of investor portfolios have also changed. Limiting the analysis to the Energy and Utilities sectors within the STOXX® Global 1800 index, which offers a global representation of developed markets, shows consistent decreases in many carbon metrics across the past four to five years.
A common carbon metric used for portfolios is emissions exposure (emissions per million invested). For both the Energy and Utilities sectors within the STOXX® Global 1800 (Figure 2), a clear downward trend can be seen in emissions per million invested in both these sectors (“Energy – Constant” and “Utilities – Constant”). However, if an investor remains invested in these two sectors within the STOXX® Global 1800 starting from 2020, the trends over the last five years are reversed for the Energy sector (“Energy – Growth”) and marginally downward for the Utilities sector (“Utilities – Growth”).
Figure 2: Emissions Exposure for STOXX® Global 1800 from Energy and Utilities Sectors
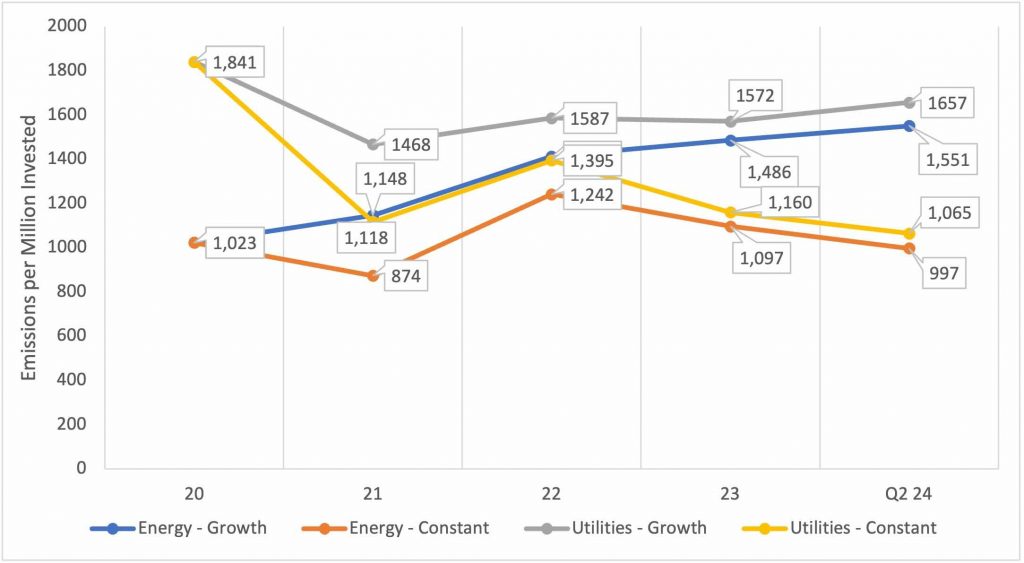
Source: ISS ESG, 2024
The constant approach assumes that the metric is calculated using the same invested value each year (e.g., $100 million), whereas the growth approach compounds the invested value in line with yearly returns of the index. The constant approach may not represent the complete picture because it does not compound growth in invested value, whereas the growth approach may better reflect the characteristics of a typical investor’s portfolio.
Among common carbon metrics, revenue-based emission intensities are a popular means for investors to track and benchmark the portfolios. Figures 3 and 4 show the trend for weighted average carbon intensity (WACI) and average emission intensity per million revenues generated, respectively. The WACI calculations are influenced by the weight of the company in the portfolio, whereas average emission intensity is merely a ratio of total emissions to total revenue for the companies within a specific sector in the portfolio.
Figure 3: WACI for Energy and Utilities Sectors within STOXX® Global 1800
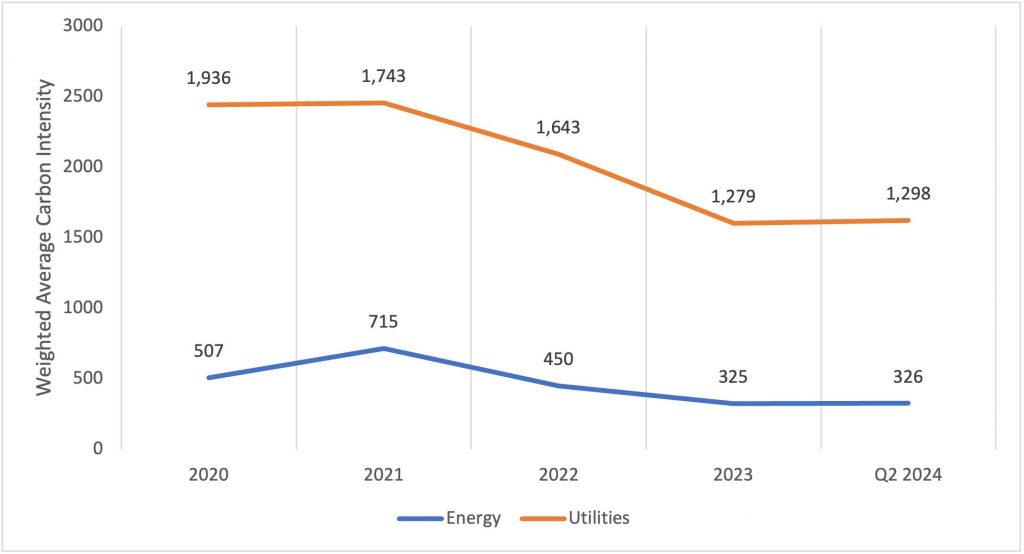
Source: ISS ESG, 2024
The WACI for companies in the Utilities sector has declined by nearly 33% over the past five years. In comparison, the WACI for Energy-sector companies has decreased by about 36% during the corresponding period.
Figure 4 showcases the trend in average emission intensity for both the Energy and Utilities sectors within the last five years.
Figure 4: Average Emission Intensity for Energy and Utilities Sectors within STOXX® Global 1800
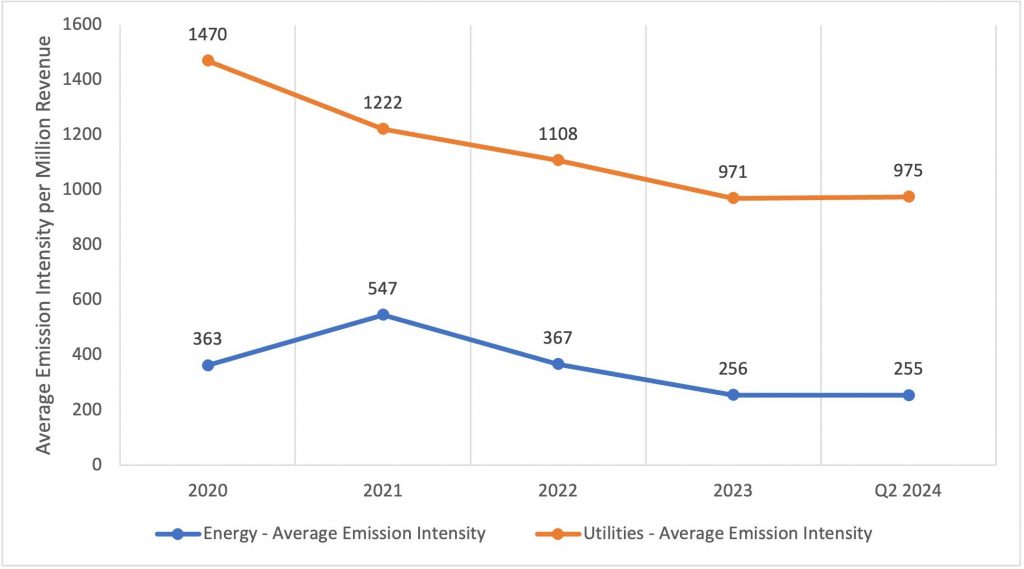
Source: ISS ESG, 2024
The decrease in the values of both WACI and average emission intensity for the Energy and Utilities sectors suggests that investor portfolios are on a path to decarbonization. This apparent trend warrants further investigation, though.
One framework that can assist in analyzing carbon metrics is emissions attribution, which can help identify drivers of metric changes over time. By breaking down the emissions intensity calculations for a given sector into different variables—for example, the change in overall emissions or change in overall revenues—the attribution can pinpoint the magnitude and scale of change impacted by specific input variables.
In the STOXX® Global 1800 Energy and Utilities sectors, the drivers of decreases in emissions intensity are varied. For the Energy sector (Figure 5), there is little evidence that the decline in emissions intensities have resulted from emissions decreases. Rather, the emissions intensity trend is determined largely by the change in sector revenues.
Figure 5: Energy Sector Emissions Attribution for STOXX® Global 1800
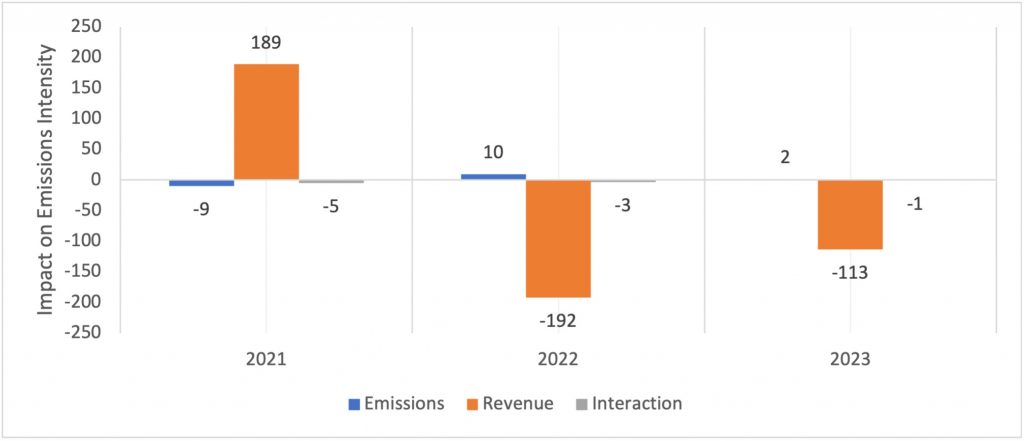
Source: ISS ESG, 2024
In contrast, the Utilities sector shows mixed evidence and demonstrates that the sector underwent some decrease in overall emissions, and increases in revenues, which have contributed to the sector’s overall decline in emissions intensity (Figure 6).
Figure 6: Utilities Sector Emissions Attribution for STOXX® Global 1800
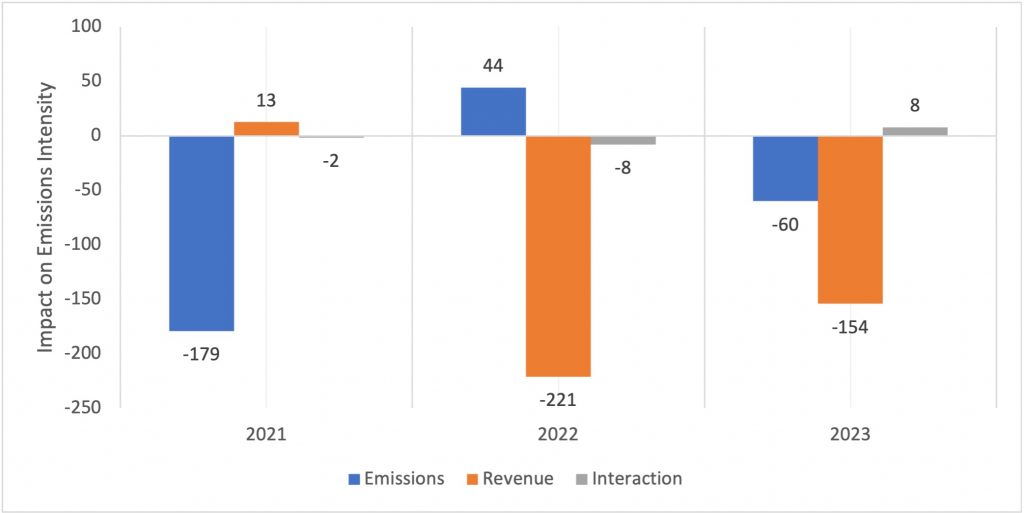
Source: ISS ESG, 2024
To elaborate further, in Figure 6, when looking at 2021, the value of -179 indicates that a decrease in sector emissions between 2020 and 2021 led to an overall decrease in sector emissions intensity. However, in 2022, the value of -221 indicates that increases of revenue (from 2021 to 2022) contributed to a decrease in sector emissions intensity.
This raises the important question: are overall carbon emissions decreasing in these sectors or is it just emissions per dollar of company value or per dollar of generated revenue that are decreasing? Are decreases in carbon intensity simply a result of the variability of market indicators and company revenues used in the calculations?
These questions require rethinking the choice of metrics for portfolio-level targets on decarbonization. Rather than being based exclusively on emission intensity-based metrics, decarbonization targets could include multiple emission metrics, to avoid the ambiguities discussed in this analysis. At the very least, investors could benefit from a thoughtful choice of carbon metrics and careful analysis of the parameters of decarbonization. As investors seek to gain a better understanding of the exposure to climate-related risks, ISS ESG offers a comprehensive suite of Climate Solutions.
Explore ISS ESG solutions mentioned in this report:
- Use ISS ESG Climate Solutions to help you gain a better understanding of your exposure to climate-related risks and use the insights to safeguard your investment portfolios.
By:
Sam Schrager, US Climate Analytics Lead, ISS ESG
Harshpreet Singh, Global Head of Climate Research, ISS ESG