The asset management industry was faced with a range of challenges and opportunities in 2022. The Federal Reserve’s rate raising campaign collided with headwinds faced by a number of companies who were not able to maintain the pace of their post-pandemic rebounds, leading to significant market losses and historic fund withdrawals. Nevertheless, the industry demonstrated its resilience and ability to adapt through its continued evolution and innovation.
2022 Asset Inflows and Outflows
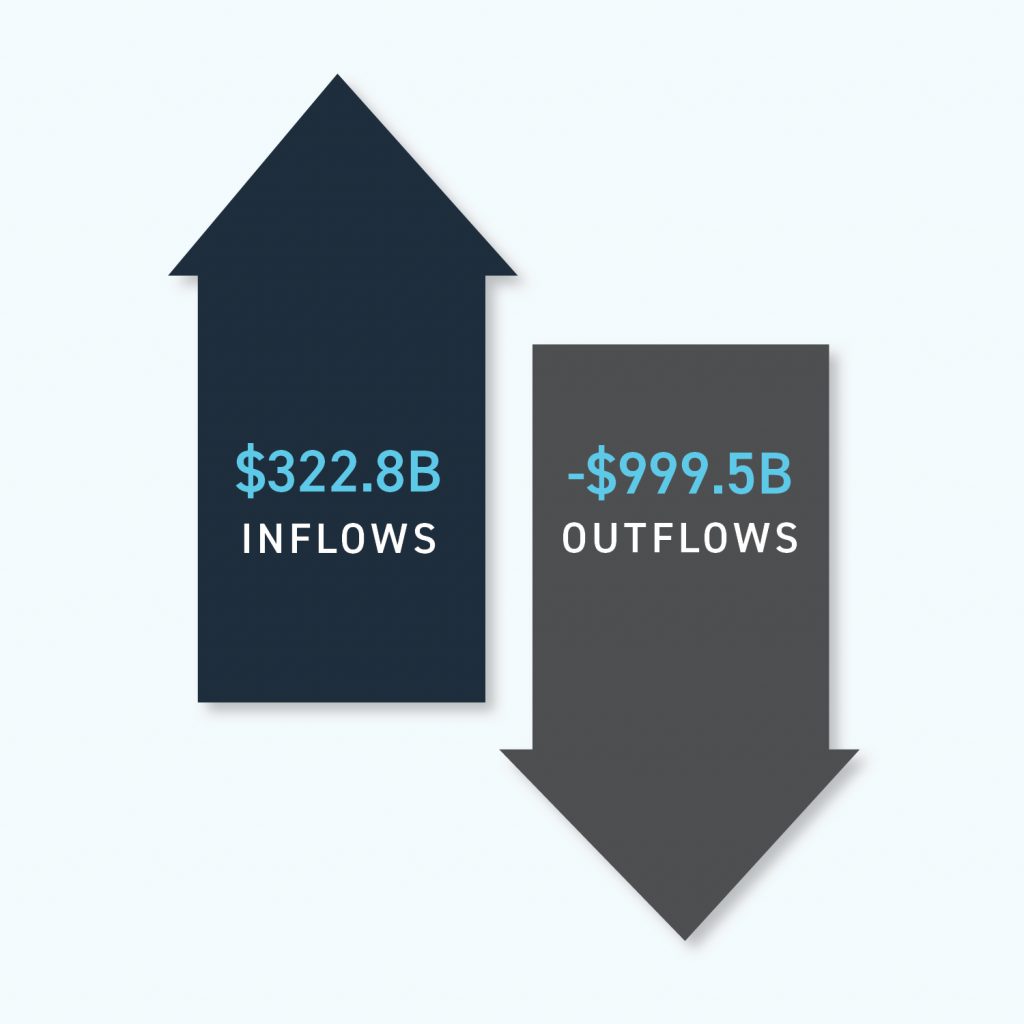
We saw renewed interest in categories such as Liquid Alternatives but also saw mainstay categories such as Blends (value and growth) and Government Funds dominate the year. 2022 was overwhelmingly a year of outflows for US domiciled (or focused) funds. In fact, on a yearly dollar flow basis, we saw net negative outflows on a scale of three to one ($999.5B in outflows versus $322.8B in inflows) for all fund categories. Of the categories we track, only 38 categories saw net inflows and 82 categories saw outflows.
A closer examination of the key trends and developments that shaped the industry in 2022 is essential for understanding where we may be headed next. To navigate the complexities of the asset management industry amid volatile and competitive markets, it is essential to have access to the right tools and resources.
Flowspring, our predictive analytics tool for asset flows, can help asset managers stay informed while navigating complexity and volatility. This agility allows users to identify product development or consolidation opportunities across asset classes, and therefore make faster, more accurate decisions.
Directionally Correct: Reviewing 2022 With Flowspring
As part of its unique predictive analytics methodology, Flowspring examines each fund and fund category across five distinct dimensions in order to predict flows. By viewing organic growth from many angles, the full breadth of investor preferences are considered. The five categories we assess are:
- Performance: factors relating to returns, including historical returns, return volatility, risk-adjusted returns, and category-relative returns
- Product: all other non-performance factors relating to funds themselves, including those for category, fees, passiveness, fund managers, asset allocations, etc.
- Parent: factors relating to brand strength and the fund family
- Distribution: factors relating to distribution of funds, including distributor entity, share class types, crowdedness, and idiosyncratic distribution effects
- Indiscriminate: base organic growth contribution independent of specific factors
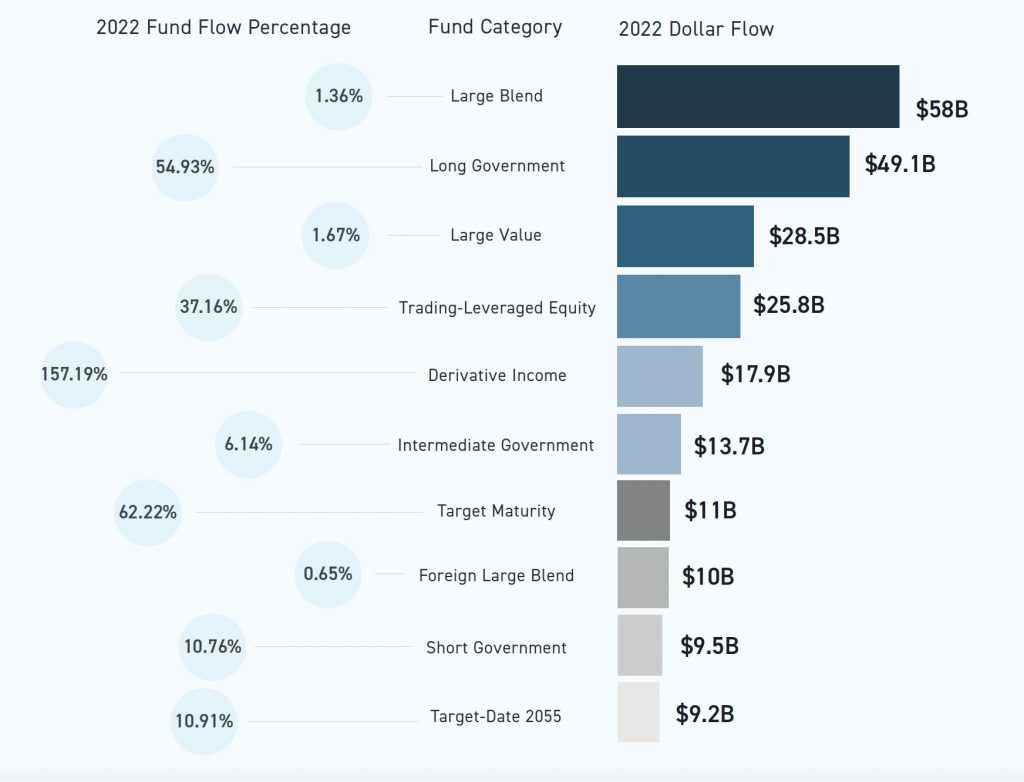
There are 50+ granular sub-factors we use in our machine learning model. Each of these factors is used to determine growth rates for fund flows and adds a data-driven responsiveness to market conditions and investor preferences. Because we utilize a non-linear algorithm, the interactions between all factors are incorporated in predicting organic growth. For the top 10 fund categories in 2022 (see below) our model showed that the main growth factors were: the fund category, three-year performance, brand and distribution. The brand and distribution factors are often excluded from traditional fund flow analysis, and provide Flowspring customers with a unique competitive edge in assessing the drivers of organic growth.
To better understand the power of Flowspring and its ability to inform asset managers one can draw a parallel with the use of technical indicators in individual equity performance. Flowspring uses a responsive approach similar to these indicators but employs an advanced machine learning mechanism to forecast near and mid-term trends. Flowspring helps you cut through significant noise and complexity by creating a more data-centric approach to decision making. It provides asset managers a unique addition to their analytic tool set to help make more informed decisions about which products will gain traction in the current market environment in order to gain competitive advantage.
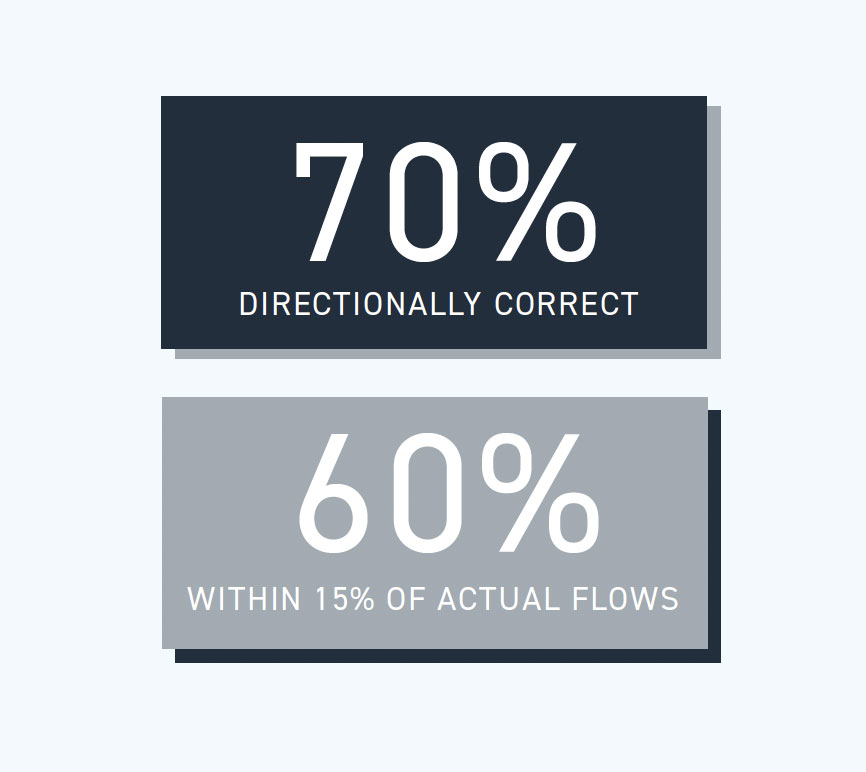
To illustrate, when we look back at 2022, we see that Flowspring was directionally correct for the top 10 funds 70% of the time, and was within 15% of the actual fund flow percentage 60% of the time. The latter statistic here is impressive despite the significant market volatility in 2022.
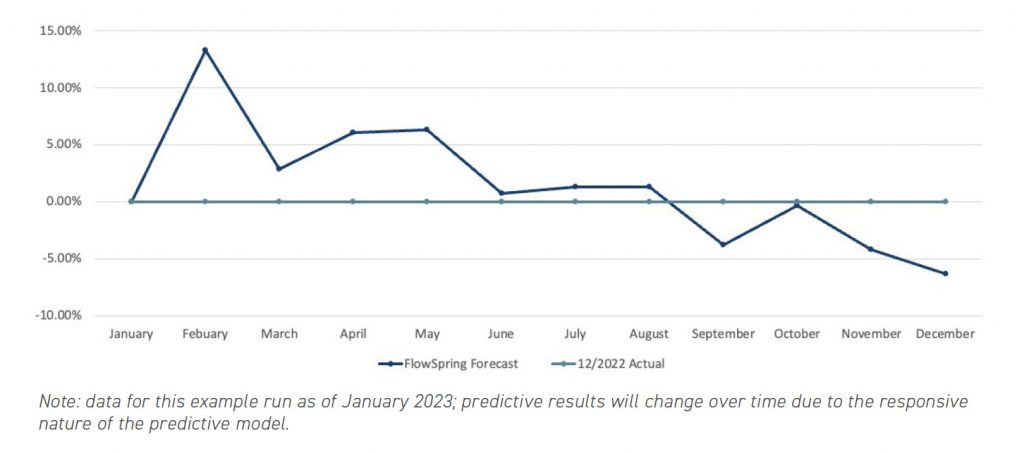
Additionally, Flowspring became more accurate in its predictions when we compare the delta percentage (difference between Flowspring prediction and actual flows) from the beginning of the year to July of 2022. In eight out of ten instances Flowspring was able to get closer to a 0% delta from the actual 2022 fund flow percentage. This demonstrates the responsive nature of Flowspring’s forecast based on market conditions.
Factors That Influenced the Bottom 10 Funds
When looking at fund outflows, we see categories such as Large Growth, Short-Term Bonds, High Yield and Foreign Large Growth being most affected by outflows. When looking at the factors that contributed to this outflow it’s no surprise that the trailing 12-month (TTM) performance and the Morningstar Category were major factors.
However, we also see that crowdedness of the share class and share class type also contributed nearly 30-50% when looking at factor weights. Since Flowspring employs a multi-factor, non-linear model it can make more accurate directional forecasts than simply looking at a few obvious factors.
Using Flowspring to Forecast 2023 Opportunities*
So, what is the Flowspring forecast for the top 10 fund categories of 2023? If the near-term trend continues, we see the Long Government category surpassing Large Blend (see below)*. Actual fund flows for Long Government in 2022 were an astonishing 54.93% and if that trend holds, we predict 34% growth over the next 12 months (NTM). The other surprise story in the near term, based on our next 12-months (NTM) forecast, is the rise of the Trading-Leveraged Equity, Derivative Income and Target Maturity categories. We predict each of these categories to continue with double-digit growth. It’s important to note that these forecasts are based on data as of January 2023 and forecasts will change as data inputs change.
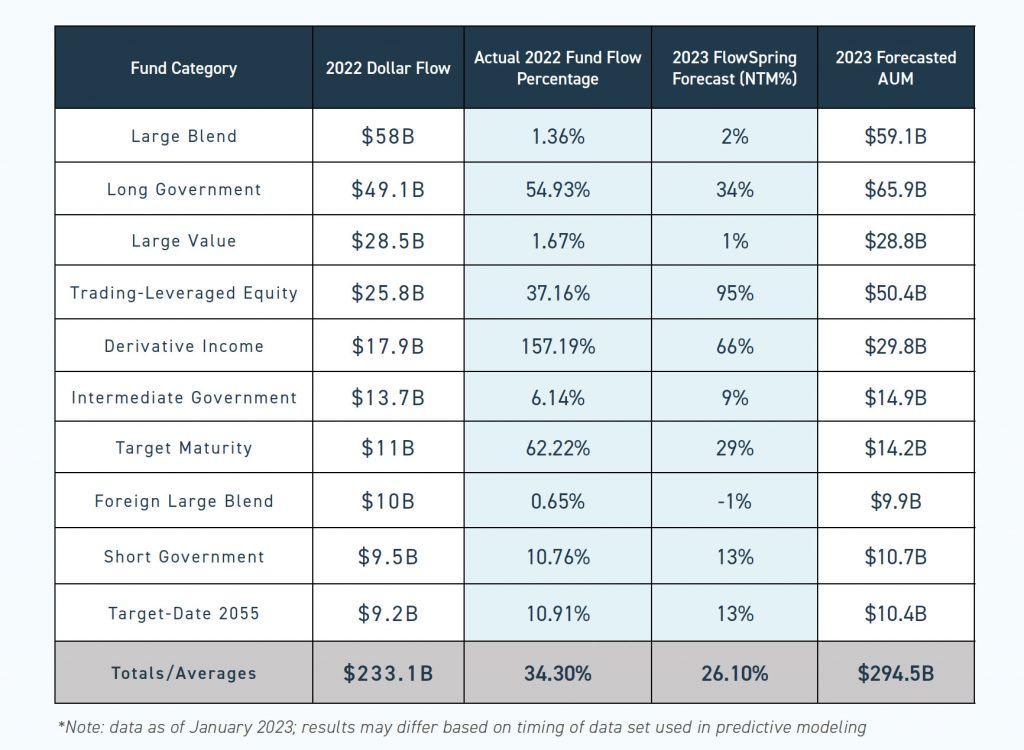
Once again, when looking at the factors that influence these forecasts, we see similar trends. The biggest factors that contribute to momentum for these categories are the fund category, three-year performance, brand and distribution. A unique element of Flowspring is that the analytics powered by machine learning are quite responsive to changes in the investment environment as fund characteristics and investor preferences change. These analytics can provide an agile, directional view of where opportunities may be found, and risks may be emerging. The analytics update on a weekly basis and rapidly respond to volatile or changing market conditions and so forecasts will change over time.
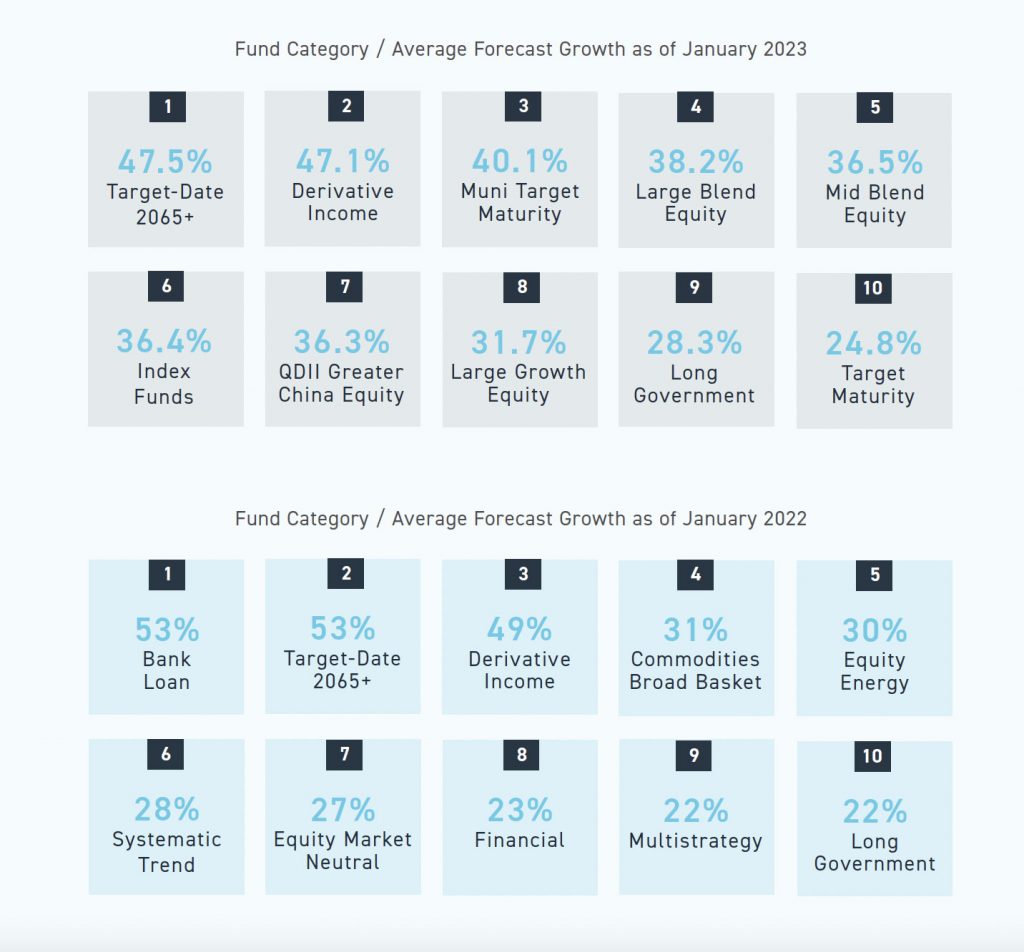
Another interesting forecast note is that target date and target maturity funds are predicted to be some of the fastest growing in the coming year. These funds comprise three of the top 10 fastest growing fund categories above $2.2B in AUM. Compare this to the prediction in January 2022 and we see only one target date fund in the top 10 fund categories by growth. Despite extensive turmoil in equity and bond markets, Flowspring predicts traditional strategies to dominate the fastest growing list.
A Data-Driven Approach to 2023
As we head into a potential recessionary environment with significant headwinds, it becomes vitally important for asset managers to have a comprehensive view of the industry. It is vital to assess the trends driving the current market and to consider a broad range of factors and inputs to make more data-driven decisions.
This environment poses unique challenges for both incumbents and newcomers. Fund categories along with brand become a vitally important driver of AUM growth for incumbents. For newcomers, fund categories and performance will likely be most important.
We’ve illustrated the rigorous quantitative methodology that drives the predictive modeling approach that Flowspring takes in determining where fund flows are headed (and how forecasts will change over time based on changes in factors and investor preferences). Our forecast for 2023 demonstrates an
overwhelming need by asset owners to invest in products that offer a flight-to-safety or diversification. By using Flowspring, asset managers now have a more scientific and data-driven approach to making strategic product development and rationalization decisions. Flowspring allows you to use a broad range of factors which provide agility and responsiveness to rapidly changing market conditions.
*Note: predictions were run based on data as of January 2023 and results may change based on timing of data used for the predictive modeling.
For more information on the Flowspring tool and its predictive modeling methodology, go to Flowspring.com, or contact us for a customized demo or for a trial
By: Saleem Khan, Executive Director, ISS Market Intelligence


