Introduction
ISS ESG presented A Guide to Climate Scenario Analysis in October 2023. The Guide detailed principles for evaluating different emissions-reduction pathways and addressing barriers to wider adoption of climate scenario analysis.
ISS ESG has since updated its Scenario Analysis product by bringing in a new set of factors. These new factors will support financial institutions in conducting effective scenario analysis and support the evaluation of public decarbonisation pathways from a range of different providers.
Using the latest industry standard on alignment methodology by capturing all three scopes of emissions and using a Glasgow Financial Alliance for Net Zero (GFANZ)-defined “fair-share” approach, ISS ESG is enhancing its solution with scenarios from the International Energy Agency (IEA), the Network for Greening the Financial System (NGFS), and the United Nations Environment Programme’s One Earth Climate Model (OECM). In total, the additions include a total of 22 new scenarios and 5 distinct Net Zero pathways. The new scenarios are accompanied by new projected emissions methodologies that cover a variety of design approaches to complement the analysis.
This post examines the methodology of the updated Scenario Analysis product, so as to help investors navigate the extensive new dataset.
Methodology in Three Steps
Scenario Alignment is the ratio between, on the one hand, the cumulative projected emissions of an issuer or an issuer’s portfolio, and, on the other hand, the issuer or portfolio’s carbon budgets. This is done for both the medium-term time horizon of 2030 and the long-term time horizon of 2050. Aligning scenarios in this way involves three steps: carbon budget allocation; projected emissions; and cumulative alignment (Figure 1).
Figure 1: Summary of the Three Steps
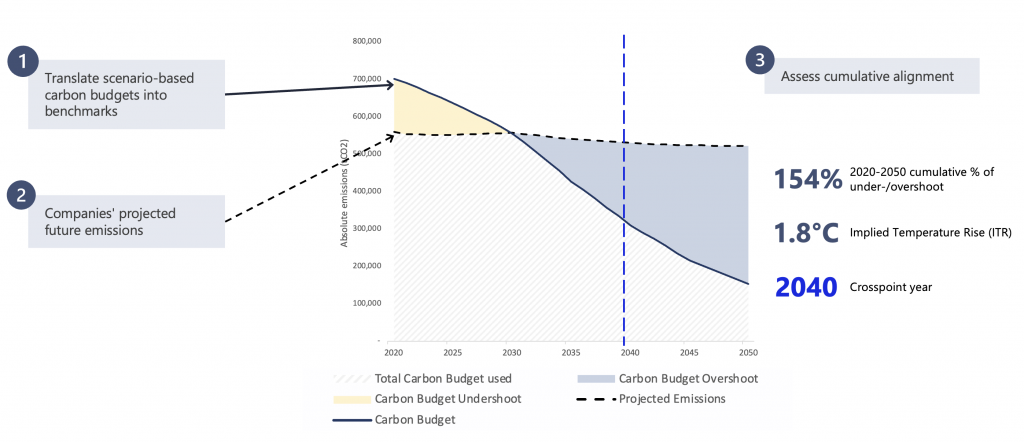
Source: ISS ESG
Step 1: Carbon Budget Allocation
There are many ways to attribute a benchmark to a specific company when calculating alignment.
First, a baseline carbon budget needs to be defined. The method that ISS ESG has decided to proceed with is the “fair-share” approach, as defined by GFANZ. Fair-share consists of attributing to a company a starting point based on the intensity of the company’s carbon use relative to the sector average, thereby creating a rate of reduction for the sector that incorporates company specificities.
A company that is more carbon efficient than its benchmark, thanks to greater previous decarbonization efforts, is rewarded for its efficiency and allocated a larger share of the carbon budget. A company that is less carbon efficient than its benchmark is allocated a smaller share of the carbon budget and therefore will have to reduce its emissions at a faster rate to catch up and align with the sector decarbonization trajectory. The “fair-share,” as implemented, uses either production-based (e.g., barrels of oil produced or GWh of electricity generated) or economic-based measures, depending on the data availability of the sector.
Second, the carbon budget trajectory until 2050 reflects sectoral and regional scenario-based emissions pathways. The Scenario Analysis methodology allocates the relevant pathway to the main carbon-intensive activities of the companies, as defined by the company’s emissions scope. The mapping (Figure 2) is done through an expert judgement mapping proprietary to ISS ESG and reconciles the diverging definitions of emissions scopes at the Corporate and Sectoral levels.
Figure 2: Carbon Budget Mapping
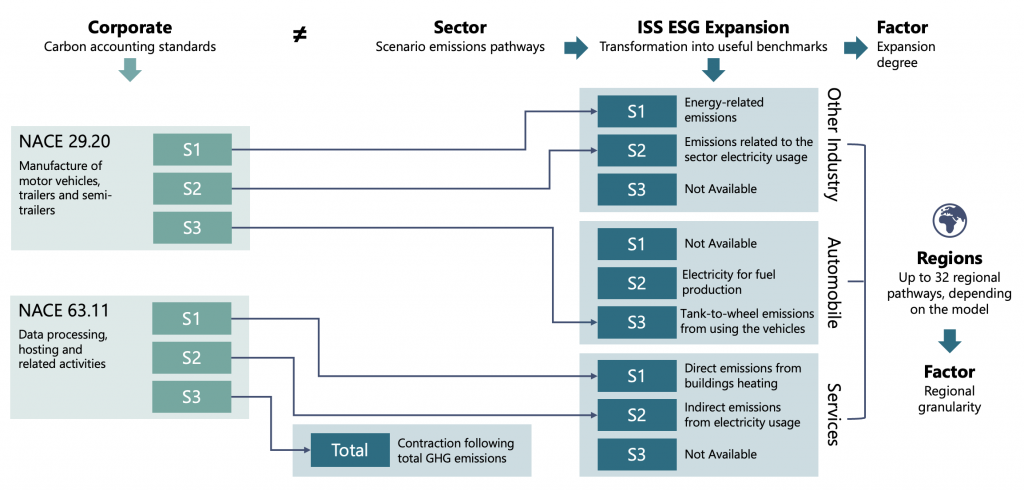
Note: S1, S2, S3 = Scope 1, 2, and 3 emissions. NACE = Nomenclature statistique des Activités économiques dans la Communauté Européenne (Statistical classification of economic activities in the European Community).
Source: ISS ESG
Step 2: Projected Emissions
The three projected emissions methodologies are as follows:
- Historical: The emissions of the company follow a perpetuity rate that is calculated based on the trajectory of the past reported emissions.
- Benchmark: The emissions are projected using a basket of current policies scenarios that is used to describe a “Business-As-Usual” projection. The projection is sector specific.
- Target: The target emissions goal enriches the benchmark-projected-emissions approach with GHG reduction target data from the company, whenever available, and is taken at face value.
Figure 3: Issuer-Projected Emissions Approaches
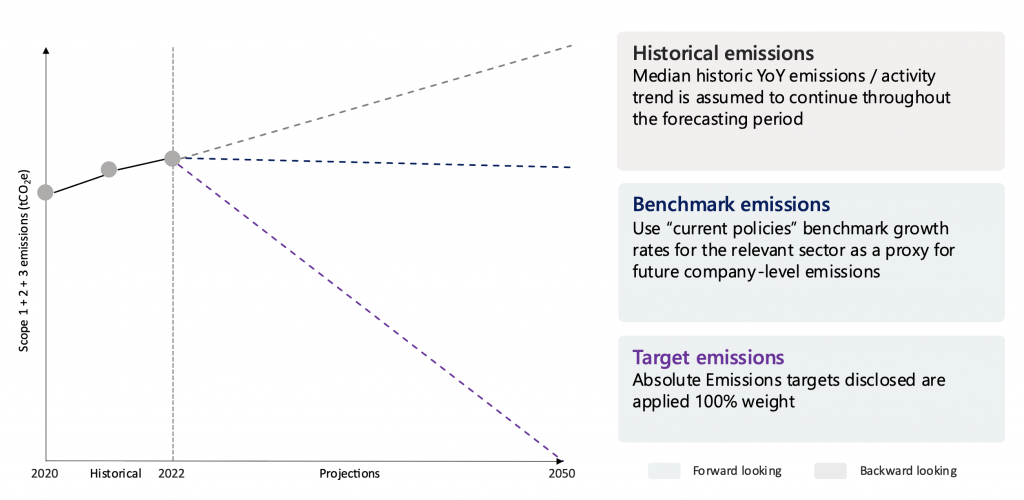
Source: ISS ESG
The alignment being a ratio between only two projection forces, the way in which the emissions of a company are being projected is a key driver of the overall alignment result. Therefore, ISS ESG has decided to provide these three distinct projected emissions approaches both for greater flexibility of choices and so the projections can be used with each other to provide more context to the results. For example, an historical projection which increases aggressively could indicate that a Net Zero target might present challenges, especially if the benchmark projection also indicates that the industry, and thus the macroenvironment, is not heading for a similar trajectory.
Step 3: Cumulative Alignment
In its latest Assessment Report, the IPCC restated that every tonne of CO2 emissions adds to global warming and a near-linear relationship can be observed between cumulative CO2 emissions and the increase in global surface temperature. The amount of carbon that society can emit before overshooting a given temperature limit is defined as its remaining carbon budget. Therefore, Net Zero scenarios must be assessed on a cumulative basis.
All results within the enhanced product are calculated on a cumulative basis at a point in time, meaning that the cumulative alignment at 2030 is the sum of each prior year (from a 2020 baseline) aggregated. A cumulative view allows users both to adhere to climate science and to prevent cliff-like trajectories that just a point-in-time analysis alone could allow.
The cumulative alignment is calculated using the ratio between the projected emissions and the carbon budget. The ratio is given as a percentage, which is considered to be overshooting if above 100% and undershooting otherwise. It is translated into an Implied Temperature Rise (ITR) using a Transient Climate Response to Cumulative Emissions (TCRE) approach.
Finally, the new Scenario Alignment dataset also gives a crosspoint-year factor, which is the year at which the company or portfolio of companies depletes its entire Net Zero carbon budget under a given model. The crosspoint-year factor adds an extra dimension to the other results factors (the cumulative alignment and the ITR), and this extra dimension gives an indication on the shape of the curve.
Conclusion
The wide array of combinations allows users of the Climate Scenario Analysis tool to fulfil a wide range of use cases. The variety of scenarios, involving end-of-century temperatures ranging from 1.5°C to 3°C+, will help users with regulatory reporting, which necessitates an array of scenarios comparison.
The combination of the result factors (cumulative alignment, ITR, and crosspoint-year factor) for different projected emissions and scenarios also provides more context and allows for comparison across different Net Zero Pathways for different projected emissions. This combination also unlocks a dynamic analysis and reading of the results. For example, understanding both the historical trajectory of a company’s emissions and the industry business-as-usual allows the user to gauge the feasibility of the target set. Also, being able to compare different issuers in critical sectors against different Net Zero pathways, which were constructed under different technology assumptions, can give more insights on decarbonisation pathways. Adding the new Scenario Alignment dataset to the Scenario Analysis product should therefore aid users in their risk management and pro-active portfolio management.
Explore ISS ESG solutions mentioned in this report:
- Use ISS ESG Climate Solutions to help you gain a better understanding of your exposure to climate-related risks and use the insights to safeguard your investment portfolios.
By:
Eran Yu, Associate Vice President, Climate & Nature Innovation Lab, Climate Transition Risk Lead, ISS ESG
Benoît Billard, Associate, Climate & Nature Innovation Lab, Climate Transition Risk Specialist, ISS ESG