Cyber security incidents can have a devastating impact on a business. The negative effects of these incidents vary from breaches involving sensitive client information that lead to identity theft, to the illicit sale of intellectual property for corporate espionage purposes, to operational disruptions following systems falling prey to ransomware. Failure to be properly prepared for these risks can result in a company’s brand equity and market value being severely impaired, resulting in regulatory fines and civil penalties and in extreme cases leading to corporate failure.
Understanding and measuring cyber security risks is critical to the risk management process. Having the tools to benchmark a company’s cyber security processes can help to identify those implementing best practices and those falling short of these benchmarks. The ISS Cyber Risk Score is such a tool.
The ISS Cyber Risk Score is produced by an empirically derived, machine-learning model that is trained on reported, material cyber incidents. The model is engineered to measure the likelihood that an organization will suffer a material cybersecurity event in the next 12 months.
The ISS Cyber Risk Score is calculated in part from indicators based on observations of a company’s public Internet-facing properties, which include the set of pay-level domains owned by the organization and the set of IPv4 network prefixes owned (or leased) by the organization. The algorithm considers several categories of technical information, including the extent of assets exposed to the Internet; the configuration of those assets; the exposure of network infrastructure; the presence, condition, and nature of exposed services; the presence of common misconfigurations and security flaws; evidence of endpoint compromise; and the use of best practices in website construction. The size and sector of the subject company also influence the score.
The model is versioned and updated on a regular basis. The score ranges from 300 (higher risk) to 850 (lower risk) and currently produces a dynamic range of 32x (the relative outcome odds across the score band). This means organizations that score 300 are roughly 32 times more likely to suffer a material cyber incident over the subsequent 12-month period than organizations scoring 850.
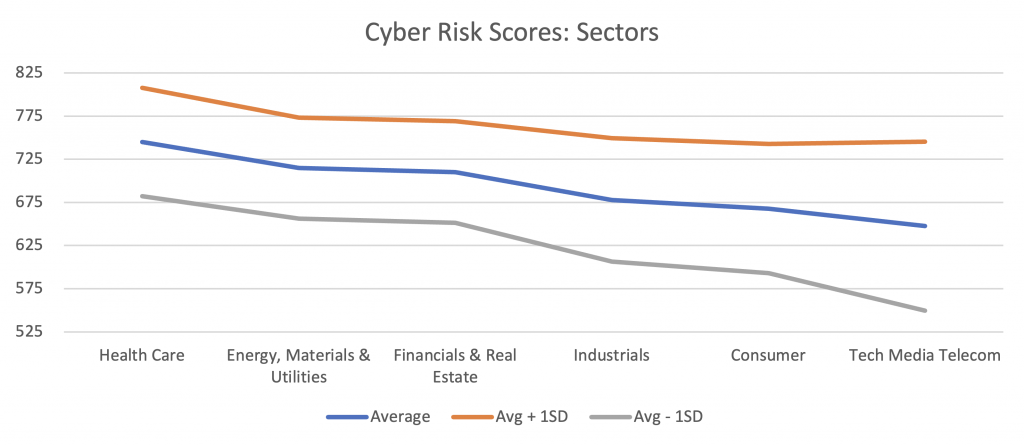
This publication illustrates the average and the standard deviation of the ISS Cyber Risk Score across sectors and showcases details pertaining to the top- and bottom-performing sectors. The larger the standard deviations of Cyber Risk Scores, the greater the variability of cyber security practices and thus the greater potential risk exposure.
Lower scores for companies indicate lower preparedness towards cyber security risks, which are rising. Capital allocation towards prevention may be too low, expertise may be lacking at the management level, or control processes may simply be lagging best practices. The ISS Cyber Risk Score can help to distinguish the leaders from the laggards and provide investors with insights applicable to their engagement and risk management efforts.
Cyber Risk Scores across Sectors
The average Cyber Risk Scores vary between 648 and 745 across the illustrated sectors, while the standard deviation (+/-1SD) shows a larger variation across sectors. Financials & Real Estate, Energy, Materials & Utilities, and Health Care have similar standard deviations of scores. Both Consumer and Technology, Media, & Telecommunications have much larger standard deviations, which imply greater dispersion and higher-than-average cyber security risks are present within these sectors.
Figure 1: Cyber Risk Scores: Average and Standard Deviations
Source: ISS ESG
Health Care Sector
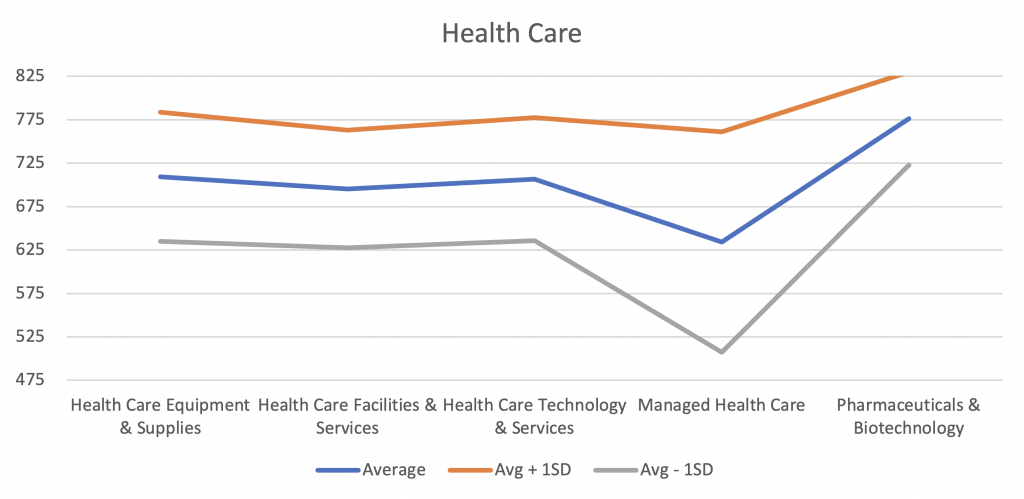
The Health Care sector contains on average the highest performers across the board, with the Managed Health Care industry scoring below the lowest average score across all sectors. The low score for Managed Health Care may indicate risk, given the amount of sensitive patient information these companies manage. This is underscored by the news earlier this year that a managed care company paid ransom to cyberthreat actors to protect patient data.
Figure 2: Cyber Risk Scores: Average and Standard Deviations: Health Care
Source: ISS ESG
Technology, Media, and Telecommunications Sector
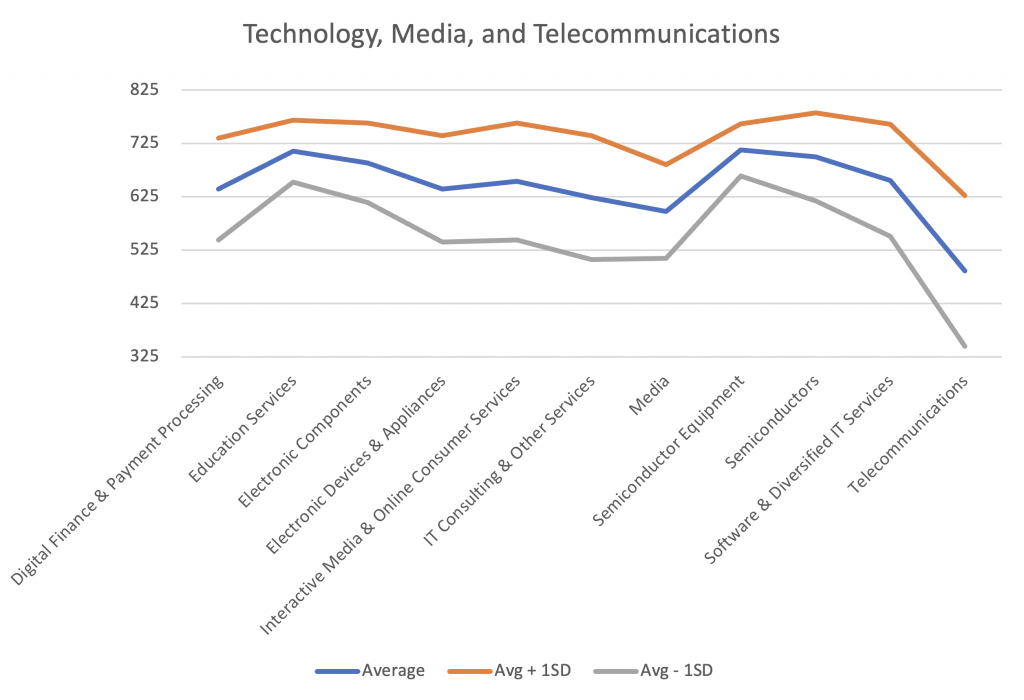
Companies within the Technology, Media, and Telecommunications sector have the highest divergence of Cyber Risk Scores compared to companies across all other sectors. In particular, the Telecommunications industry, followed by Software & Diversified IT Services, illustrate the widest array of scores. The presence of low Cyber Risk Scores within these industries may be cause for concern for investors, given the widespread presence of these industries’ services within people’s professional and personal lives.
Figure 3: Cyber Risk Scores: Maximum and Average: Technology, Media, and Telecommunications Sector
Source: ISS ESG
Investors concerned with benchmarking and curious to understand how the ISS Cyber Risk Score can assist their analysis can reach out to ISS ESG sales executives in their regions.
Explore ISS ESG solutions mentioned in this report:
- Assess and manage cyber risk across your ESG investments with ISS Cyber Risk Score.
By: Roberto Lampl, Managing Director, Corporate Ratings Research, Head of Industrials, Financials, & Real Estate Sectors, ISS ESG
