Key Takeaways:
- The impact on biodiversity of global equities can be measured through the Potentially Disappeared Fraction of Species (PDF) and the Mean Species Abundance (MSA) metrics from the ISS ESG Biodiversity Impact Assessment Tool (BIAT).
- Within a global universe of large and mid-capitalization companies, biodiversity loss is largely driven by land-use change. Broken down by sector, Consumer Staples, Materials, and Industrials are most impactful in both Developed Markets (DM) and Emerging Markets (EM). The Packaged Foods and Meats sub-industry has the largest footprint.
- Impact is concentrated. The top 100 most impactful companies globally contribute to about 60% of total PDF. The top 20% of companies in the universe contribute to 83% of total PDF.
- The ISS STOXX Biodiversity Index Series can help portfolios achieve substantial reductions in PDF, while also reducing carbon emissions and enhancing exposure to biodiversity-aligned Sustainable Development Goals.
The Importance of Biodiversity to Investors
Biodiversity refers to the variety of all forms of life on Earth, ranging from genes and bacteria to entire ecosystems such as forests or coral reefs. Biodiversity loss refers to declining species diversity and abundance, which may lead to the disruption of these ecosystems.
Climate change is one key reason for biodiversity loss, along with changes in land and water use, pollution, direct exploitation of natural resources, and invasive species. In recent decades, human activities such as converting unexploited land to agricultural production have contributed to a rapid loss of natural ecosystems and biodiversity.
The World Economic Forum’s 2023 Global Risks Report listed “biodiversity loss and ecosystem collapse” as one of the most pressing global risks over the next decade. In terms of the global economy, about $58 trillion (or more than half of global GDP) is dependent on nature. The same analysis identifies more than 50% of the market value of listed companies on 19 large stock exchanges as being exposed to material nature-related risks.
The UN Environmental Program has identified important and interconnected industries – such as Agricultural Products and Fisheries or Food, Beverage and Tobacco – which have high impact and high dependence on biodiversity and healthy functioning ecosystems (Figure 1). Biodiversity loss and ecosystem degradation may pose risks to business operations, supply chains, and financial markets.
Figure 1: Industries with High Impact and Dependence on Biodiversity
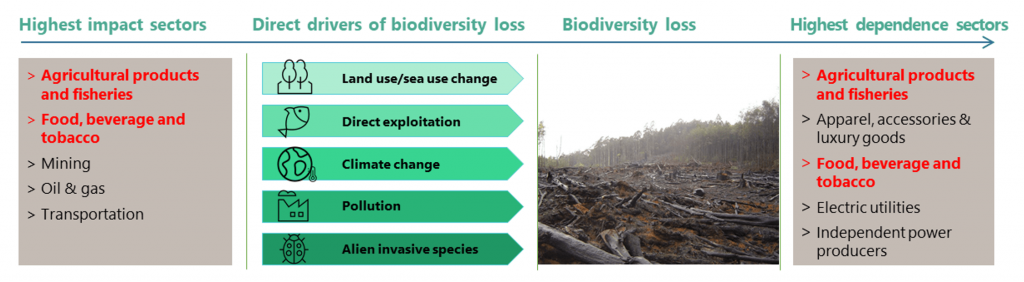
Source: UN Environment Program, UNEP Finance Initiative and Global Canopy (2020); IPBES (2019). “Deforestation” by crustmania is licensed under CC BY 2.0.
The public and private sectors have both recognized biodiversity’s importance. At the United Nations Biodiversity Conference (COP15) in December 2022, representatives from 188 governments adopted the Kunming-Montreal Global Biodiversity Framework (GBF). As described in a previous paper, the GBF targets (known as 30×30) include placing 30% of the planet and 30% of degraded ecosystems under protection by 2030. Members of the financial sector have also committed to tackle biodiversity loss by signing pledges such as the Finance for Biodiversity Pledge and adopting reporting frameworks such as that of the Taskforce on Nature-related Financial Disclosures (TNFD).
Investors may wish to consider the impact biodiversity loss could have on their portfolios over the long-term. The ISS ESG Biodiversity Impact Assessment Tool (BIAT) enables investors to better assess and quantify biodiversity risks to their portfolios.
Measuring Biodiversity Loss
BIAT considers a direct set of corporate environmental impacts on species and habitats, throughout a company’s entire value chain and its geographic revenue footprint. The tool is built on a robust and proven Life Cycle Impact Assessment (LCIA) methodology (IMPACT World+) that incorporates recognized databases such as EXIOBASE, Ecoinvent, and company‐specific revenue data, while also drawing on ISS ESG’s proprietary biodiversity performance data.
One main output of BIAT is the Potentially Disappeared Fraction of Species (PDF or Absolute PDF) metric, which quantifies the potential loss of species richness due to adverse environmental pressures, relative to species richness in undisturbed ecosystems, often referred to as the pristine state. Species richness refers to the number of unique species in an area. PDF is defined over both area and time (unit: PDF.km2.year), and larger PDF values indicate a greater negative impact on biodiversity.
Another key output of BIAT is the Mean Species Abundance (MSA) metric, which quantifies the mean abundance of original species relative to their abundance in undisturbed ecosystems. MSA is also defined over both area and time (unit: MSA.km2.year), and larger MSA values indicate a greater negative impact on biodiversity.
In contrast with well-established metrics such as carbon emissions, investors may be less familiar with biodiversity metrics. To help investors familiarize themselves with PDF, the following sections both aggregate and slice PDF for the STOXX World All Country (AC) series of global equity benchmarks (3,623 constituents). While MSA will be the subject of an upcoming article, this article focuses on the “refined” PDF metric, which enhances the base “unrefined” PDF metric by incorporating additional biodiversity-related information through the ISS ESG Corporate Rating dataset.
At the index region level, the aggregate PDFs of Emerging Markets equities and Developed Markets equities are 889 million PDF.km2.year and 1,019 million PDF.km2.year, respectively. That indicates a relatively even split across regions, despite Developed Markets having a higher aggregated market capitalization (Figure 2).
Figure 2: Aggregate PDF by Index Region
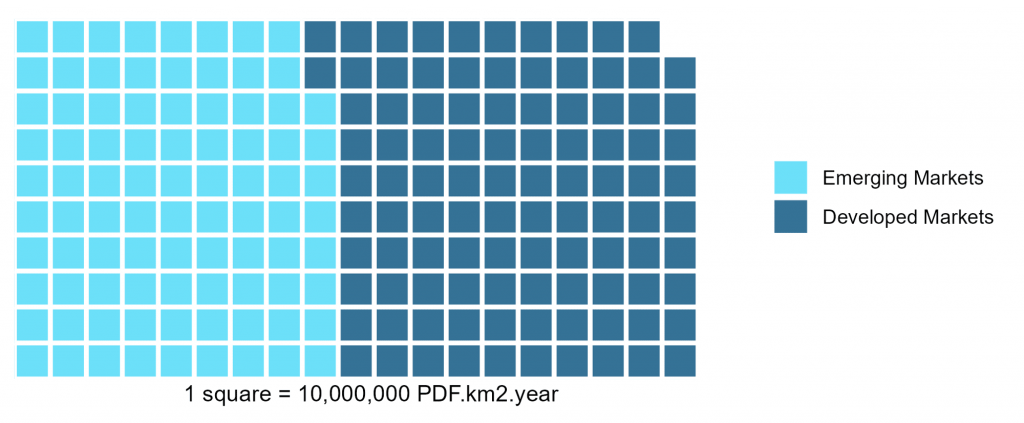
Source: ISS ESG, July 2023
As a company’s size influences its PDF, the PDF metric can also be provided as a normalized ratio per million USD of revenue, and is referred to as PDF Intensity. In terms of intensity, the weighted average PDF.km2.year.$m revenues are 58.60 in Emerging Markets and 32.04 in Developed Markets. This means EM have an 80% higher PDF intensity than DM, indicating a greater adverse biodiversity impact per dollar invested in this index region.
The section below breaks down PDF data across several dimensions to provide investors with additional perspective on this dataset.
Global Breakdown of PDF by GICS Sector and Drivers of Biodiversity Loss
Biodiversity Impact Assessment Tool (BIAT) data indicate that the Consumer Staples sector has the largest impact on biodiversity in both Emerging and Developed Markets, followed by the Materials and Industrials sectors (Figure 3).
Figure 3: Aggregate PDF by Sector
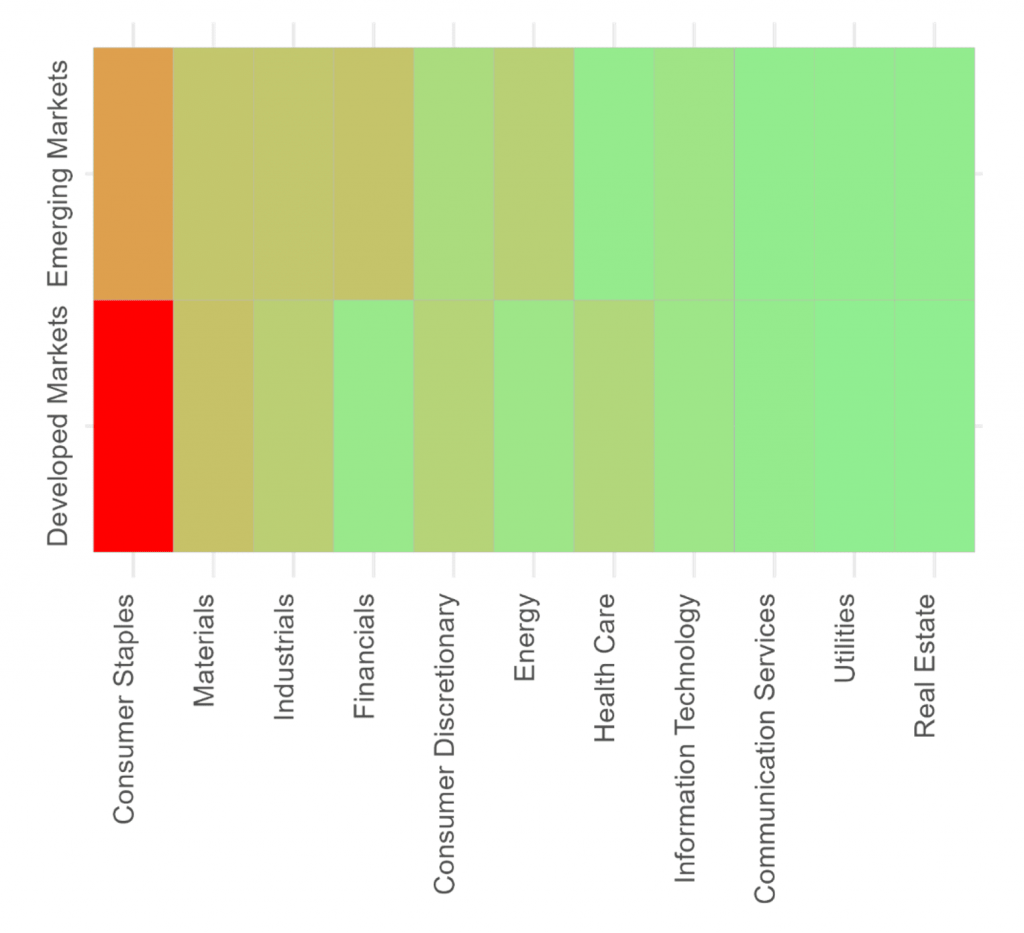
Note: Red values indicate relatively greater impact while green indicates lower impact.
Source: ISS ESG, July 2023
Breaking the data down further into sub-industries, Packaged Foods & Meats has the largest total PDF in both Emerging and Developed Markets (Figure 4).
Figure 4: Aggregate PDF for Top 10 Sub-Industries, by Market Region
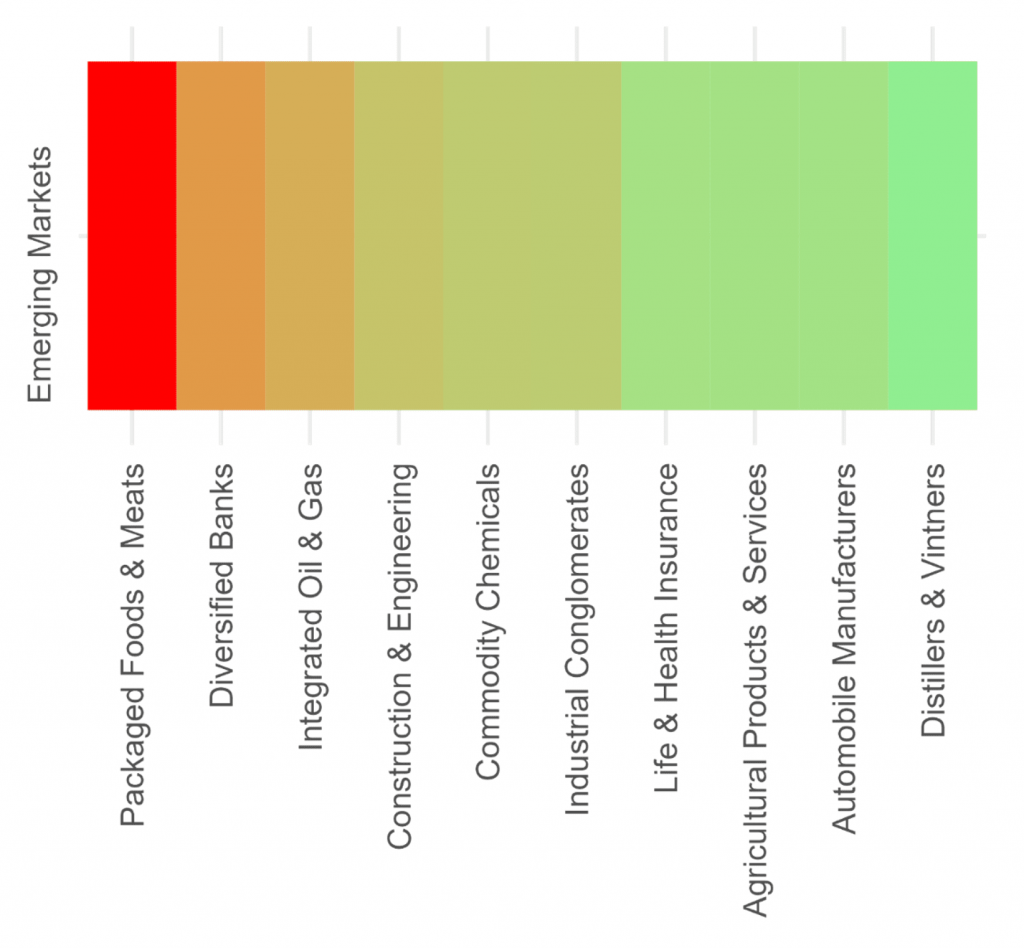
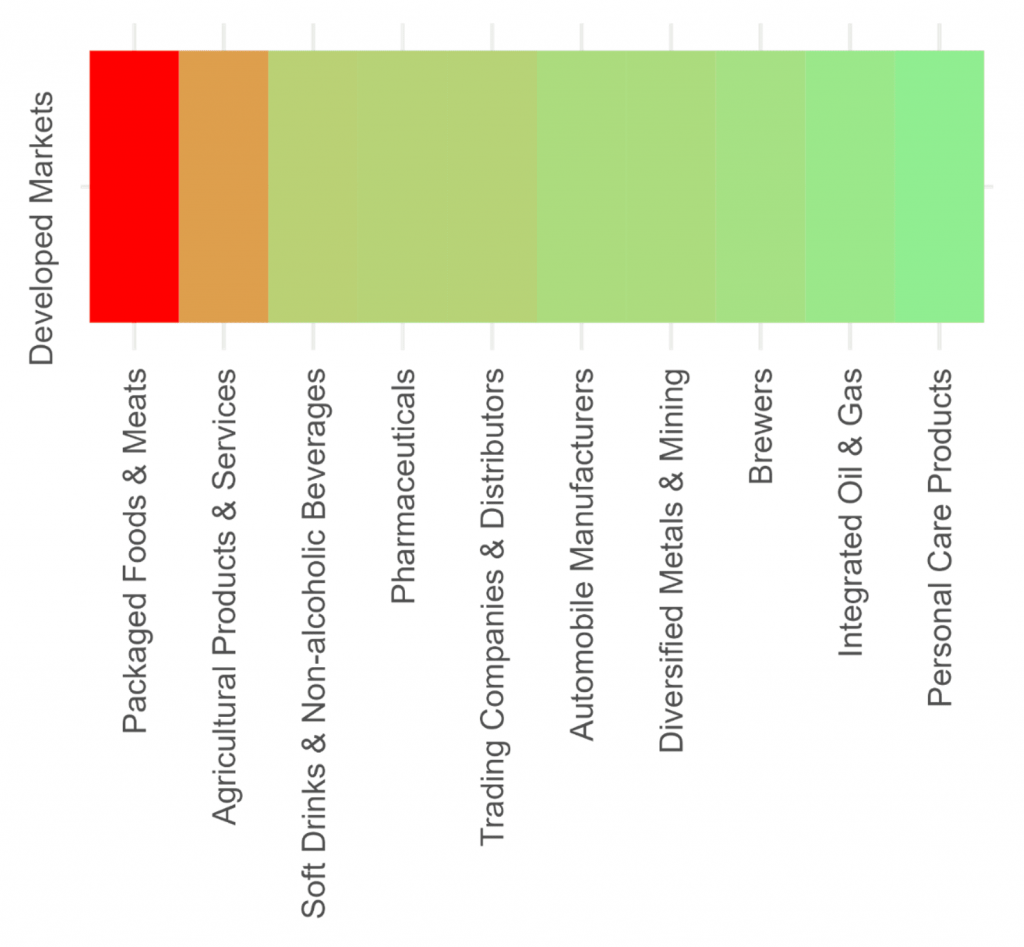
Note: Red values indicate relatively greater impact while green indicates lower impact.
Source: ISS ESG, July 2023
BIAT can also identify the principal individual drivers contributing to biodiversity loss, known as the midpoints. The ten tracked midpoints are Climate Change Ecosystem Quality, Marine Acidification, Freshwater Acidification, Terrestrial Acidification, Freshwater Eutrophication, Marine Eutrophication, Freshwater Ecotoxicity, Water Availability Freshwater Ecosystem, Land Transformation, and Land Occupation.
According to BIAT data, the Land Transformation midpoint is the largest driver of biodiversity loss in both Developed and Emerging Markets. Land Transformation refers to the difference in biodiversity over the area considered before and after transformation. It corresponds to the impact associated with land-use change (LUC) and the associated loss of biodiversity due to the transition from a natural to a human-managed state, a transition that creates both a direct loss of terrestrial biodiversity and a loss of ecosystem services such as water and climate regulation.
Climate Change Ecosystem Quality, Marine Acidification, and Terrestrial Acidification follow Land Transformation in driving biodiversity loss. Figure 5 shows the impact of the ten midpoints, grouped according to the UN’s Intergovernmental Science-Policy Platform on Biodiversity and Ecosystem Services (IPBES) key drivers.
Figure 5: Direct Drivers of Biodiversity Loss
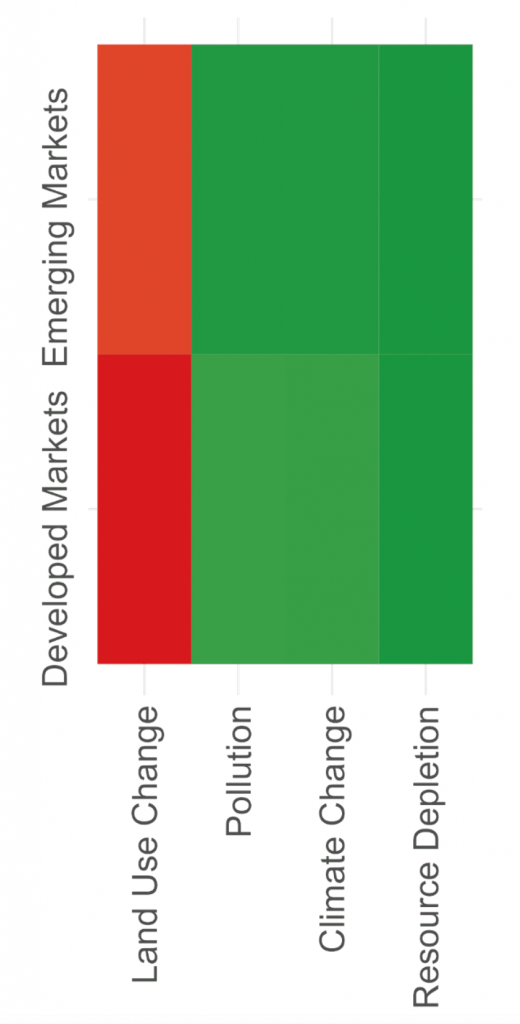
Note: ‘Land Use Change’ includes the midpoints Land Transformation and Land Occupation; ‘Pollution’ includes Marine Acidification, Freshwater Acidification, Terrestrial Acidification, Freshwater Eutrophication, Marine Eutrophication, and Freshwater Ecotoxicity; ‘Climate Change’ includes Climate Change Ecosystem Quality; and ‘Resource Depletion’ includes Water Availability Freshwater Ecosystem. BIAT biodiversity midpoint data is based on unrefined PDF. Red values indicate relatively greater impact while green indicates lower impact.
Source: ISS ESG, July 2023
PDF Distribution among STOXX World AC Issuers
In both Developed and Emerging Markets, the biodiversity footprint is not evenly spread. The top 100 companies in both regions contribute to about 60% of total PDF. The top 20% of companies in the universe contribute to 83% of total PDF (Figure 6).
Figure 6: Cumulative PDF, by Index Region
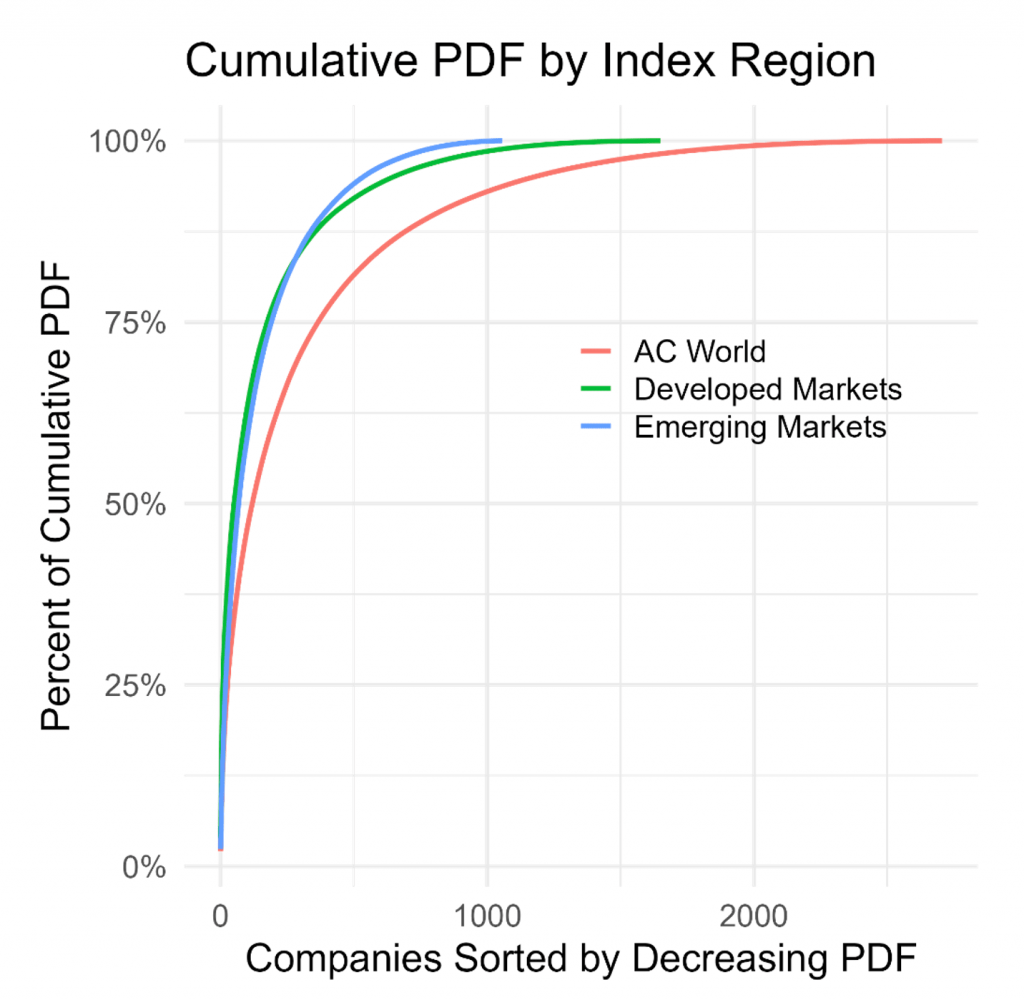
Source: ISS ESG, July 2023
Assessing a Company’s Biodiversity Impact
ISS ESG’s Biodiversity Impact Classification categorizes a company’s impact considering both Absolute PDF and PDF Intensity. A company can fall into one of five impact categories, illustrated in Figure 7. This holistic approach helps remove distortions which can occur in intensity measurement due to disproportionately high (or low) revenues.
Figure 7: Biodiversity Impact Classification, by PDF Metrics
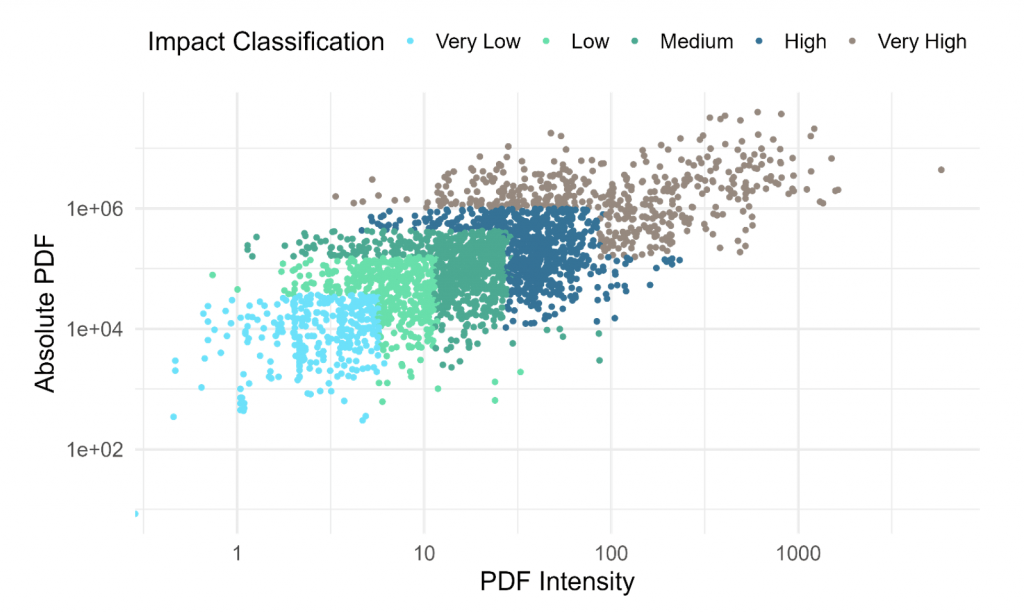
Note: Absolute PDF unit: PDF.km2.year; PDF Intensity unit: PDF.km2.year.$m revenues
Source: ISS ESG, July 2023
Firms rated ‘Very High’ are typically from industries facing the biggest challenges in abating their biodiversity impact. This includes land-use intensive industries such as Food, Mining, or Forestry, and others with high pollution impact such as Chemicals, Household, or Personal Care Products.
‘Medium’ scoring firms tend to come from industries that may be of particular interest to investors, such as Construction, Metals Processing, or Manufacturing. These may present active management opportunities for tangible and realistic biodiversity impact abatement.
Index Tools for Managing Biodiversity Impact
Launched in June 2023, the ISS STOXX Biodiversity Index Series is a global suite of indices focused on biodiversity. These indices tilt toward companies that minimize their biodiversity footprint, as measured by PDF intensity, and exclude companies identified as involved in activities harmful to biodiversity.
The suite consists of two index series:
- ISS STOXX Biodiversity indices, which track companies with high biodiversity- and climate-related Sustainable Development Goal (SDG) scores; and
- ISS STOXX Biodiversity Leaders indices, which include companies with high revenues from specific SDG-related activities.
Both index series have global and regional versions, which reduce their carbon intensity by at least 30% relative to their parent STOXX indices, such as the STOXX World AC series.
The resulting indices present a significant reduction in PDF values: a 25% reduction in the case of the ISS STOXX World All Country (AC) Biodiversity Index, and a nearly 90% reduction for the ISS STOXX World All Country (AC) Biodiversity Leaders Index (Figure 8). In addition, carbon emissions are significantly reduced, and revenue exposures to biodiversity-aligned SDGs are enhanced.
Figure 8: Measuring Impact: ISS STOXX Biodiversity Index Series
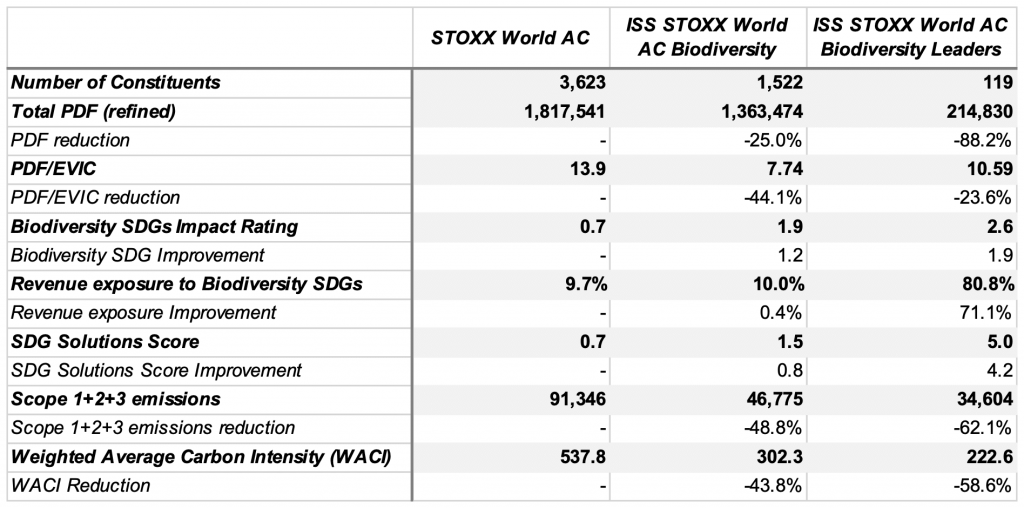
Note: AC = All Country; EVIC = enterprise value including cash. As of June 2023. Scope 1+2+3 emissions are based on €100MM notional value. WACI based on EVIC denominator.
Source: STOXX
Biodiversity loss is likely to continue to rise in importance within institutional investors’ sustainability agendas. Investors may wish to consider the impact of companies on biodiversity, and the risks such impact has for their portfolios. Tools such as the ISS ESG Biodiversity Impact Assessment Tool and the ISS STOXX Biodiversity Index Series can support investors in this area.
Explore ISS ESG solutions mentioned in this report:
- ISS ESG’s Biodiversity Impact Assessment Tool helps investors assess the impact of companies’ business and supply chain activities on biodiversity.
- Identify ESG risks and seize investment opportunities with the ISS ESG Corporate Rating.
Authored by:
Hernando Cortina, CFA, Managing Director, ISS ESG
Reza Marvasti, Senior Associate, ISS ESG
Moe Phyu, Associate, ISS ESG