Key Takeaways
- Contrary to unfavorable perceptions, in 2023 assets under management (AUM) of sustainable funds outgrew those of conventional funds globally, as well as in Europe and North America specifically.
- Global sustainable mutual and exchange-traded funds (ETFs) received $94 billion net flows in 2023, which accounted for a larger percentage of their AUM than net flows did for conventional funds.
- Sustainable ETFs had faster AUM growth than conventional ETFs, with over 30% growth in all regions. This trend suggests sustainable index-based approaches may continue to gain market share.
Asked to comment on an 1897 newspaper article which announced his own passing, Mark Twain quipped that “Reports of my death have been grossly exaggerated.” This retort comes to mind when considering some of the current pessimistic market narratives regarding sustainable investing. To the contrary, a review of 2023 sustainable funds data from ISS Market Intelligence (SIMFUND) reveals a picture of much more resilient performance.
Amid geopolitical conflicts and higher interest rates, 2023 was indeed more challenging for sustainable funds than prior years. While net flows into sustainable funds slowed in 2023 compared with 2022, funds data indicate that they continued to significantly outpace net flows for the overall funds industry. Sustainable fund assets fared better than those of conventional funds and benefited from positive net flows over the full year. This is true globally, as well as in Europe and North America, which jointly account for over 97% of sustainable fund assets. Overall, the data could suggest that the secular trend toward sustainable investing remains intact.
Flow Trends for Sustainable Funds
This analysis focuses on equity and fixed income funds, which totaled $43.5 trillion in AUM as of December 2023. The “sustainable” and “conventional” categories rely on the Morningstar classification available on SIMFUND (“unclassified” funds fall within the conventional category in the analysis). Based on this classification, there are $41 trillion in conventional funds and ETFs, while $2.5 trillion are in sustainable funds and ETFs, as shown in Figure 1. Drilling down, the majority of sustainable AUM, around 84%, is domiciled in Europe (including “International”).
Figure 1: AUM by Fund Type (Dec 2023, $ trillion)

Note: Funds are equity and fixed income funds. Uncategorized funds are included with conventional funds.
Source: ISS Market Intelligence – SIMFUND
To analyze the major sustainable funds’ market trends, this analysis focuses on 2023 AUM growth and new fund flows. Sustainable funds’ AUM grew globally by 21.1% last year, ahead of the 16.3% growth in conventional funds. The contrast is starker in Europe, at 22.5% (sustainable) versus 14.5% (conventional). While less pronounced, the same pattern also holds in North America, at 19.5% vs 16.5%, as shown in Figure 2.
Figure 2: 2023 Sustainable and Conventional Funds AUM Growth

Note: Funds are equity and fixed income mutual funds and ETFs. Uncategorized funds are included with conventional funds.
Source: ISS Market Intelligence – SIMFUND
Looking at 2023 global net flows, $94 billion were added to sustainable funds, led by Europe at $97 billion (Figure 3). In North America, inflows were only $1.6 billion. The rest of the world experienced outflows.
Figure 3: 2023 Sustainable Net Flows

Note: Funds are equity and fixed income mutual funds and ETFs.
Source: ISS Market Intelligence – SIMFUND
To compare sustainable flows to conventional flows, it is necessary to normalize by end-2022 AUM, given the much larger asset base of conventional funds (Figure 4). By this measure, sustainable funds again outpaced conventional funds. Globally, sustainable funds had net flows of 4.5%, compared with 1.2% for conventional funds. In Europe, sustainable funds outpaced conventional funds 5.6% versus 0.4%, while in North America sustainable funds’ net flows were 0.6% versus no significant net flows for conventional funds.
Figure 4: 2023 Sustainable and Conventional Net Flows

Notes: 2023 Net Flow calculated as percent of 2022 AUM. Funds are equity and fixed income mutual funds and ETFs. Uncategorized funds are included with conventional funds.
Source: ISS Market Intelligence – SIMFUND
Flow Trends for ETFs
Given the overall market shift toward ETFs, another way to look at sustainable investing is to focus exclusively on ETFs. As expected, AUM growth is stronger for ETFs specifically than for funds overall, with sustainable funds again leading the way at 37.3%, compared with 25.2% for conventional funds (Figure 5). Similar growth rates hold for both types of ETFs in Europe and North America.
Figure 5: 2023 Sustainable and Conventional ETF AUM Growth

Notes: Funds are equity and fixed income ETFs. Uncategorized funds are included with conventional funds.
Source: ISS Market Intelligence – SIMFUND
Regarding net flows, sustainable ETFs had net flows of $51 billion, led by Europe at $40 billion and North America at $7 billion (Figure 6).
Figure 6: 2023 Sustainable ETF Net Flows

Notes: Funds are equity and fixed income ETFs.
Source: ISS Market Intelligence – SIMFUND
Measuring net flows as a percentage of 2022 AUM, sustainable ETFs grew by 16.5%, well ahead of conventional ETFs’ net flow growth of 9.2% (Figure 7). Europe and North America experienced similar growth rates.
Figure 7: 2023 Sustainable and Conventional ETF Net Flows

Notes: 2023 Net flow calculated as percent of 2022 AUM. Funds are equity and fixed income ETFs. Uncategorized funds are included with conventional funds.
Source: ISS Market Intelligence – SIMFUND
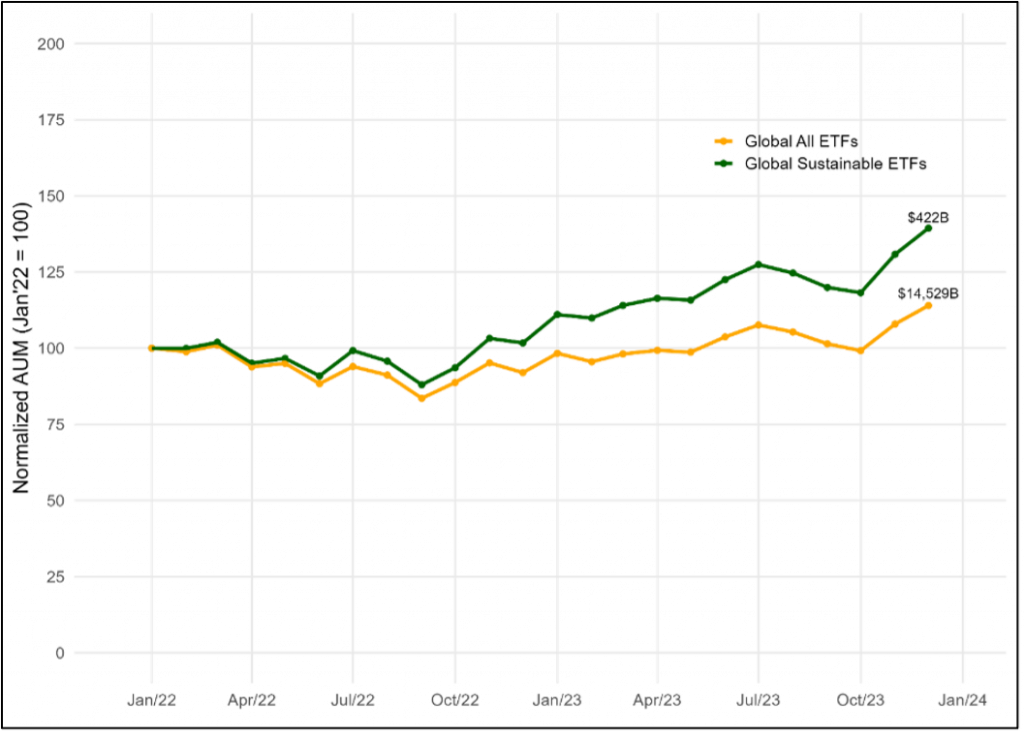
Looking exclusively at trends over the past two years, the AUM growth rate in the $422 billion global sustainable ETF market has meaningfully outpaced that of the almost $15 trillion overall global ETF market (Figure 8).
Figure 8: ETF AUM Growth Rate: Sustainable vs All ETFs

Source: ISS Market Intelligence – SIMFUND
Despite North American Weakness, Sustainable Funds Continue to Grow
Globally, sustainable funds’ assets continue to grow faster than those of conventional funds. This pattern applies to both Europe and North America. Net flows as a share of AUM are also greater for sustainable than for conventional funds. These trends are more pronounced in the overall faster-growing ETF market.
Granted, the European market accounts for most sustainable fund assets, and net flows in North America have slowed to a trickle. (Europe’s sustainable ETF market notably is 6x larger than North America’s.) Looking at the longer term, the share of sustainable funds remains low, at 4-6% of total AUM, suggesting there could remain significant room for expansion, with ETFs potentially leading. Index-based strategies, such as the Paris-Aligned Benchmarks, which have gained widespread acceptance could benefit.
The duration of the current slowdown in sustainable funds in North America is an open question and Europe currently appears to benefit from a more supportive regulatory environment. Nonetheless, globally the long-term societal and demographic trends toward sustainability appear well supported. According to a January 2024 survey from Morgan Stanley: “More than half of individual investors say they plan to increase their allocations to sustainable investments in the next year, while more than 70% believe strong ESG practices can lead to higher returns.” The report also notes that in the United States 84% of individual investors are interested in sustainable investing, with the highest interest among Millennials (96%) and Generation X (91%).
Explore ISS ESG solutions mentioned in this report:
- Quickly and effectively evaluate & benchmark the ESG performance of equity and bond funds globally using the ISS ESG Fund Rating service.
By:
Hernando Cortina, CFA, Managing Director, ISS ESG
Moe Phyu, Associate, ISS ESG


