
Cracking the European market as a fund manager is no easy task. The market is both saturated, encompassing over 25,000 funds, and stands out for its diversity of fund buyers both across Europe and within the larger domiciles. Choosing which strategy to launch—and where—is therefore no simple calculation. It involves weighing one’s odds of success both in terms of developing a winning investment strategy and being able to successfully market and distribute such strategy in a given domicile. These odds luckily are not a complete mystery. Leveraging ISS MI’s historical dataset via Simfund can in fact offer perspective on the chances of a new fund achieving a defined level of assets under management (AUM).
To have a better understanding of how Simfund’s dataset can be leveraged in the product development and idea validation process, let us consider the question of which domicile provides an active equity fund with its best chance of success.
The UK is the Place to Be!
The below box and whisker plot maps out the distribution of assets under management (AUM) for active equity funds at their first, third and fifth anniversaries for funds launched after 2010 for select European domiciles. What is abundantly clear is that the UK domicile outshines Ireland, Luxembourg, Switzerland, France, and Germany when it comes to AUMs achieved by funds in their first 12 to 60 months.
Figure 1: The Higher Highs of UK Domiciled Active Equity Funds
Distribution of AUMs of active equity funds at 12, 36 and 60 months from launch for select domiciles
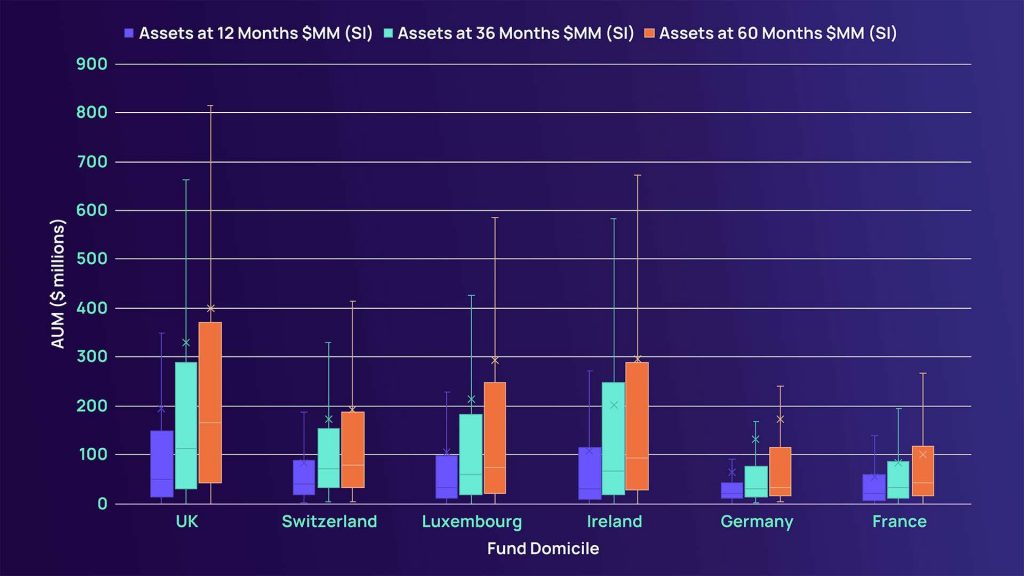
Source: ISS MI Simfund
Note: Data as of September 2023. Only funds launched since 2010 are included.
Examining the chart above, UK domiciled active equity funds—whether at their first, third or fifth anniversaries—have higher than average AUMs (the ‘x’), higher third quartile AUMs (see the top of the bar chart), and higher median AUMs (the line within the bar chart). Meanwhile, Ireland and Luxembourg were a close second and third in terms of providing the richest waters for active equity fund managers. Also, notably, the cross-border markets provide similarly significant upside (the highest point on the line extending above the bar chart) for fund managers as the UK does. After these three domiciles, the waters become much less rich. Switzerland is a bit of an outlier here, as the median fund does comparably well against the cross-border markets, but the best-selling funds fall far short. This type of result likely speaks to the intricacies of the dominant managers in a market and specifically their distribution capabilities. Having access to internal distribution (many Swiss managers are part of larger banking/wealth management groups) is likely to provide a floor for a fund’s success. With internal distribution, a manager can guarantee that a fund will have an audience at launch, if not an internal investor from Day 1. The openness of a banking or wealth manager’s product shelf, however, may mean that even the related fund manager’s products must compete for flows and that access is no guarantor of success.
All else being equal, a fund manager can expect, based on historical results, that the launch of an active equity fund launched in the UK will achieve a higher AUM at an equivalent AUM percentile compared to other jurisdictions. One could even argue that an above average launch in many other countries will generate less AUM for an active equity fund than an average one in the UK. For example, looking at the chart below, a 50th percentile UK-domiciled fund had an AUM of $164 million at its fifth anniversary. The equivalent percentiles for Irish and Luxembourg-domiciled funds at the $164 million AUM level were 62nd and 68th.
Figure 2: Know Your Odds. Not All European Domiciles Are Created Equal
AUM for UK domiciled active equity funds compared to other European domiciles at a fund’s five-year anniversary
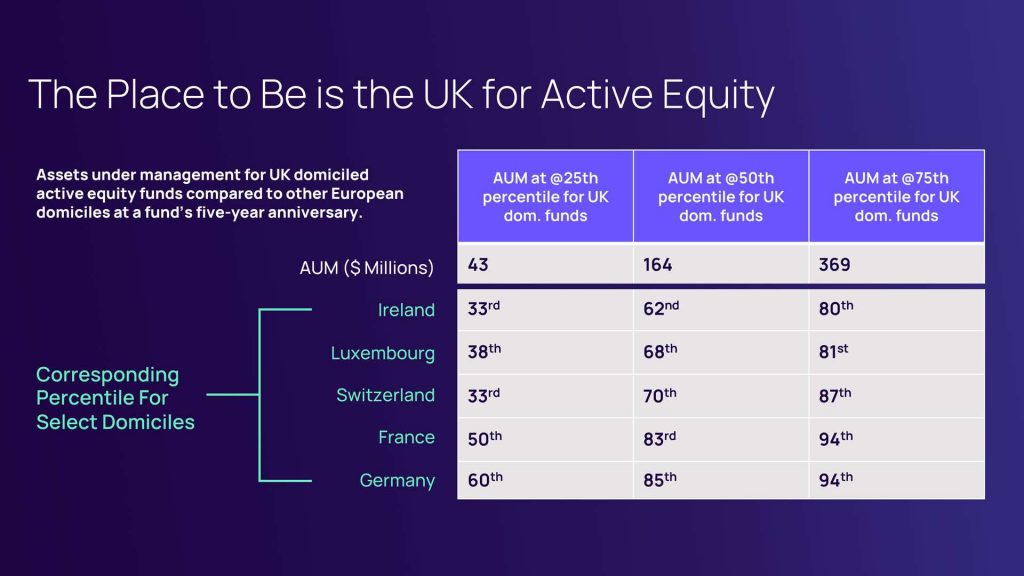
Source: ISS MI Simfund
Note: Data as of September 2023. Only funds launched since 2010 are included.
Always Remember. Your Focus Determines Your Reality – George Lucas
While the above table further reinforces the idea that the UK offers the greatest opportunity for active equity funds, this should not be interpreted as saying that all fund managers would do best to launch their next active equity fund in the UK. Rather, its purpose is to help fund managers understand how successful their fund needs to be in each domicile to achieve a similar AUM level. With fund managers often having significantly different marketing and distribution capabilities across European markets, the above table can then be used to help fund managers comprehend the opportunity sets in front of them. For example, if one has limited access to distribution in the UK—and therefore is likely to achieve only an AUM level between the first and second quartile—but rich relationships in Switzerland, where third or fourth quartile success would be expected, then fund launched in Switzerland may in fact have a higher expected AUM at the end of its fifth anniversary. Afterall, a third or fourth quartile Swiss-domiciled fund is estimated to outperform a first or second quartile UK-domiciled fund on an AUM basis after five years.
Taken together, the above charts can serve as a starting point for developing post-launch AUM scenarios for various product ideas. It is these scenarios that can then help filter the product pipeline. It is with this in mind that five additional assets at datapoints have been added to Simfund. The datapoints track a fund’s AUM at 12, 24, 36, 48 and 60 months and can be used for forecasting and peer benchmarking purposes. While the past does not predict the future, that does not mean one cannot improve their odds of success.
Explore how Simfund can help you leverage these datapoints to improve your product pipeline prioritization efforts, and learn more about ISS Market Intelligence.
Commentary by ISS Market Intelligence
By: Benjamin Reed-Hurwitz, Vice President, EMEA Research Leader, ISS Market Intelligence