Key Takeaways
- At the end of calendar year 2022, ISS data showed that 35% of the S&P 500 used at least one specific E&S metric in their pay programs, as compared to 20% as of June 30, 2021. E&S metrics are most commonly included in short-term incentive plans.
- The prevalence of E&S metrics was much higher for large U.S. energy companies. When looking at the largest U.S. energy companies in both 2021 and 2022, only 19% did not disclose the use of at least one specific E&S metric in their executive short-term incentive program.
- While many of the large U.S. energy companies reviewed incorporated E&S metrics that were quantitative in nature, the disclosure of specific E&S target goals lagged disclosure of financial targets in the same incentive programs. However, between 2021 and 2022 there was improvement in the level of disclosure of E&S targets in short-term incentive plans.
Overview
While market participant viewpoints on environmental and/or social (E&S) metrics in executive incentive programs have been and continue to be mixed, the prevalence of such metrics in public company executive incentive programs has continued to grow over the past few years. An ISS Corporate Solutions study showed that by June 30, 2021, approximately 20% of the S&P 500 Index had incorporated at least one E&S metric into their incentive programs. At the end of calendar year 2022, ISS data showed that 35% of the S&P 500 used at least one stand-alone E&S metric. This percentage would be even higher if it also included the number of companies that incorporated environmental or social performance into executives’ individual objectives or strategic goals.
Adoption of E&S Metrics
Energy Companies were Early Adopters and Continue to Use E&S Metrics
E&S metrics are now seen across all industries but some of the earliest adopters in the U.S. market were energy companies. The use of E&S metrics aligns with the greater potential impact such companies can have on the environment and the various business risks and opportunities that may be associated, as well as the necessary focus on worker and community safety. For purposes of this article, we have examined disclosure for S&P 500 companies within the 1010 GICS industry group. This GICS industry group incorporates both Energy Equipment and Services as well as Oil, Gas, and Consumable Fuels. See the Appendix for a full list of included companies.
We reviewed the metrics used in each company’s short-term incentive (STI) program, because E&S metrics are most commonly included in short-term plans. This article discusses only stand-alone E&S metrics that were clearly disclosed as a part of the incentive program. Some of the companies may also include E&S-focused criteria in assessments of individual or strategic performance; however, our analysis focused on companies that clearly disclose specific E&S metrics. We also reviewed the financial metrics used in each company’s STI program, including those that were not related to E&S.
Examples of environmental metrics used included GHG emissions targets, flaring reduction goals, and number of spills or environmental incidents, among others. Almost all of the social metrics identified in this study were related to worker or community safety. Only one company used a clearly defined social metric other than safety, which measured diversity in management. For purposes of discussion and for ease of display, this measure has been included in the charts below in the category entitled “safety.” In addition, financial measures in the STI plans included metrics such as free cash flow, return on capital, EBITDA, and operating expenses, among others.
E&S Metrics in STI Programs
Most Energy Companies Incorporated some Environmental and/or Safety Metrics into STI Programs
When examining STI program metrics within the 1010 GICS industry group, like in most industries, financial measures were the most common. Each of the 21 companies allocated a majority of the STI payout to financial performance metrics.
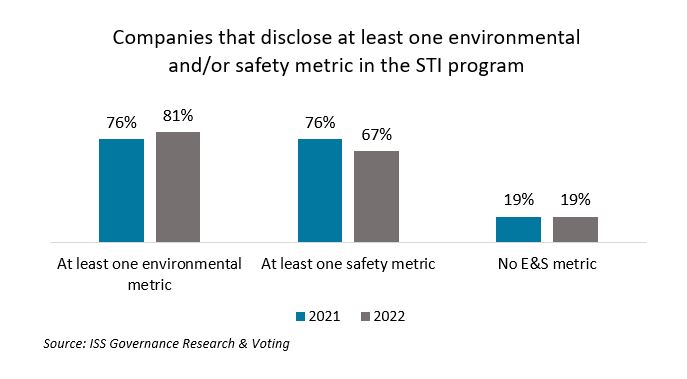
Only 19% of the companies reviewed did not incorporate an environmental or safety metric into the STI program in either 2021 or 2022. 76% of companies used at least one environmental metric in 2021, which increased to 81% in 2022. However, while 76% of companies used a safety metric in 2021, this percentage dropped to 67% for 2022.
When reviewing the total number of E&S metrics, we observed that very few companies selected just a single E&S metric. In fact, only one company chose to include a single E&S metric in their STI program. For those companies that incorporated E&S metrics, most included between two and three metrics, with a few companies reporting as many as seven in a single year.
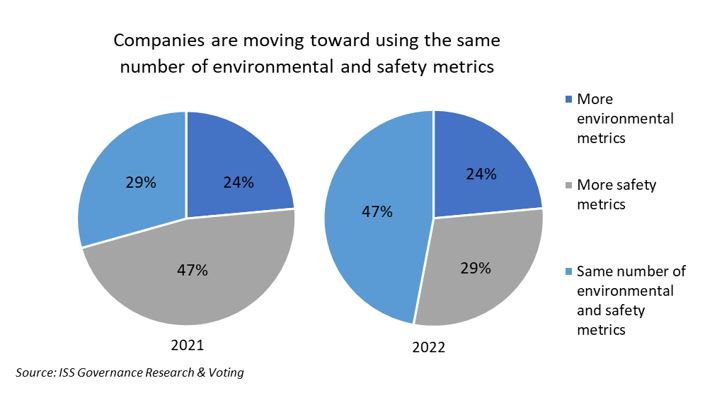
When looking at companies with multiple E&S metrics, 24% used more environmental metrics in 2021 than safety metrics, while 47% used more safety metrics. Just 29% of companies used the same number of environmental and safety metrics in 2021; however, this figure increased to almost half of the companies in 2022. The growth in the percentage of companies using the same number of environmental metrics as safety metrics was primarily due to an increase in the use of environmental metrics rather than a decline in the use of safety metrics.
It was often difficult to review the specific weightings allocated to each E&S metric within an STI program, as not all companies clearly disclosed how these metrics directly impacted the payout formula. However, for companies that did disclose the weightings, most fell between 5% and 15% of the STI opportunity, with the median for environmental and safety metrics each at approximately 10% of the total STI formula.
E&S Metrics and Disclosure
Disclosure of Targets is Lacking for E&S Metrics as Compared to Financial Goals
ISS has heard from many investors that they expect companies to clearly disclose quantitative targets and actual results for the majority of STI program metrics, and this extends to E&S measures. Although many of the E&S metrics reviewed in this study were quantitative in nature, a significant portion of companies did not disclose quantified targets in their proxy statements. This was particularly apparent for E&S metrics when compared to the financial metrics that had clearly disclosed targets in most of the same incentive programs. While just 14% of financial metrics lacked target goal disclosure in 2021, more than half of environmental metric targets and 44% of safety metric targets were not clearly disclosed.
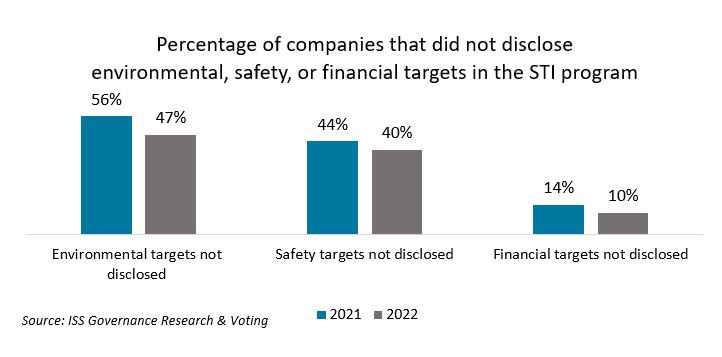
There was improved disclosure in 2022, when the percentage of undisclosed targets dropped from 56% to 47% for environmental goals and from 44% to 40% for safety goals – while undisclosed targets decreased for financial metrics as well. However, E&S target disclosure was still much more limited than target disclosure of financial goals in both years.
Conclusion
Over three-quarters of energy companies within the S&P 500 Index have already incorporated one or more E&S metric in their STI program. As expected, this percentage is well above the level of incorporation of E&S metrics within the broader S&P 500. Further, most of those companies chose to incorporate more than one E&S metric into the STI program, indicating a broader focus than just a single measure of environmental or safety progress within the organization. There was also movement between 2021 and 2022 toward the increased use of environmental metrics, often matching the number of safety metrics, which represented a shift from programs that incorporated a larger number of safety metrics.
While many companies do not disclose the specific weighting allocated to individual E&S metrics, for those that do, these continue to comprise a relatively small portion of STI payouts. Nevertheless, given the increasing prevalence of E&S metrics use, company disclosure surrounding specifically how individual metrics impact payout formulas could be improved. In addition, there continues to be limited transparency around goal-setting and target disclosure for many E&S metrics, often in contrast to the financial goals within the same STI program. This impedes investors’ ability to evaluate the structure and goal rigor of the overall program and may be especially challenging for investors who are focused on E&S metrics. However, the improvement in E&S target disclosure seen between 2021 and 2022 may reflect a recognition of shifting investor expectations around clear disclosure for E&S metrics.
Appendix
List of companies that were in the 1010 GICS industry group and the S&P 500 Index for both 2021 and 2022, and reviewed in this study:
| APA Corp. | Kinder Morgan, Inc. |
| Baker Hughes Company | Marathon Oil Corporation |
| Chevron Corporation | Marathon Petroleum Corporation |
| ConocoPhillips | Occidental Petroleum Corporation |
| Coterra Energy Inc. | ONEOK, Inc. |
| Devon Energy Corporation | Phillips 66 |
| Diamondback Energy, Inc. | Pioneer Natural Resources Company |
| EOG Resources, Inc. | Schlumberger NV |
| Exxon Mobil Corporation | The Williams Companies, Inc. |
| Halliburton Company | Valero Energy Corporation |
| Hess Corporation |
By: Rachel Hedrick, Kevan Marvasti
