Government agencies and scientific organizations around the world have reported an array of climatic anomalies during the boreal summer of 2023. Instances include record global land and ocean temperatures, record lows in Antarctic sea ice extent, and the rising incidence of wildfires. Some of the most visibly tragic wildfire examples are in dispersed locations including, but not limited to, western and eastern Canada, Greece, Italy, Spain, and a dozen U.S. states, particularly Hawaii.
The objective of this paper is to share some of the latest climate data which has been reported, the summary conclusion of the U.N. IPCC’s Climate Change Synthesis Report published in March 2023, and a snapshot of the current state of tools available for investors wishing to integrate climate considerations into their portfolio construction and reporting.
Climate Anomalies from the Summer of 2023
Climatic anomalies observed during the 2023 summer included the following:
Record Global Temperatures Reported by Multiple Governmental Authorities
The EU’s Copernicus Climate Service notes, “The global average temperature for July 2023 is confirmed to be the highest on record for any month. The month was 0.7°C warmer than the 1991-2020 average for July, and 0.3°C warmer than the previous warmest month, July 2019. The month is estimated to have been around 1.5°C warmer than the average for 1850-1900.”
According to NASA: “This July was not just warmer than any previous July – it was the warmest month in our record, which goes back to 1880.” Finally, another U.S. government agency, the National Oceanic and Atmospheric Administration (NOAA), notes that it is “virtually certain” that 2023 will rank among the five-warmest years on record, with a nearly 50% probability that 2023 will rank as the warmest year on record.
Figure 1: 2023 Daily Temperatures Compared with 1979-2000 Mean
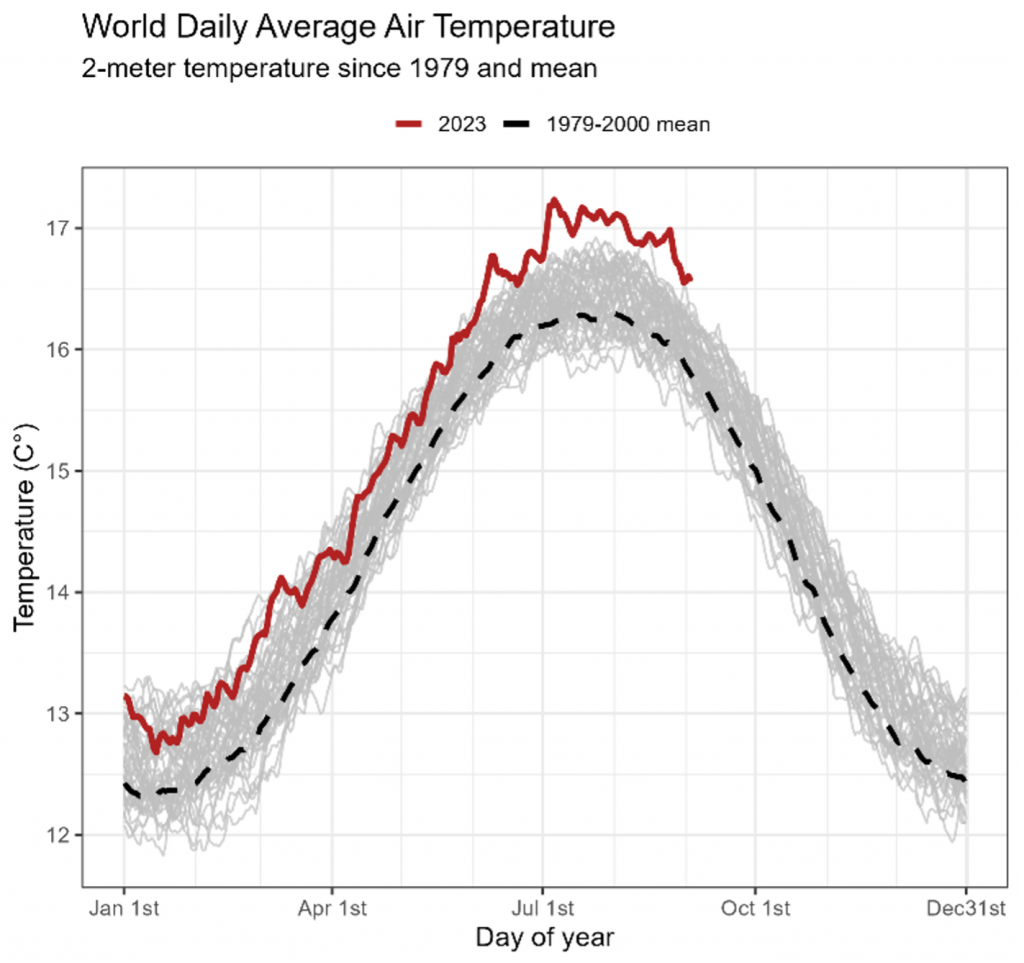
Notes: 2-meter air temperature is the temperature of air 2 meters above the surface of land, sea, or inland waters
Source: Climate Change Institute, University of Maine. Climatereanalyzer.org as of 2023-09-03.
Unprecedented Seasonal Antarctic Sea Ice
According to NOAA, the Antarctic sea ice extent ranked as the lowest on record for a third-consecutive month, running about 2.5 million square km — nearly the size of Argentina — below the 1991–2020 average. This was below the previous record low, from July 2022. Separately, on the other side of the world, the Arctic sea ice extent for July 2023 ranked as the 12th lowest in the satellite record since 1979. In addition to prompting urgent warnings about the changing climate from the scientific community, the decline in sea ice appears to have already proven disastrous for emperor penguins, which have recently failed to breed at a level never seen before in parts of Antarctica.
Figure 2: Record-Low Antarctic Winter Sea Ice
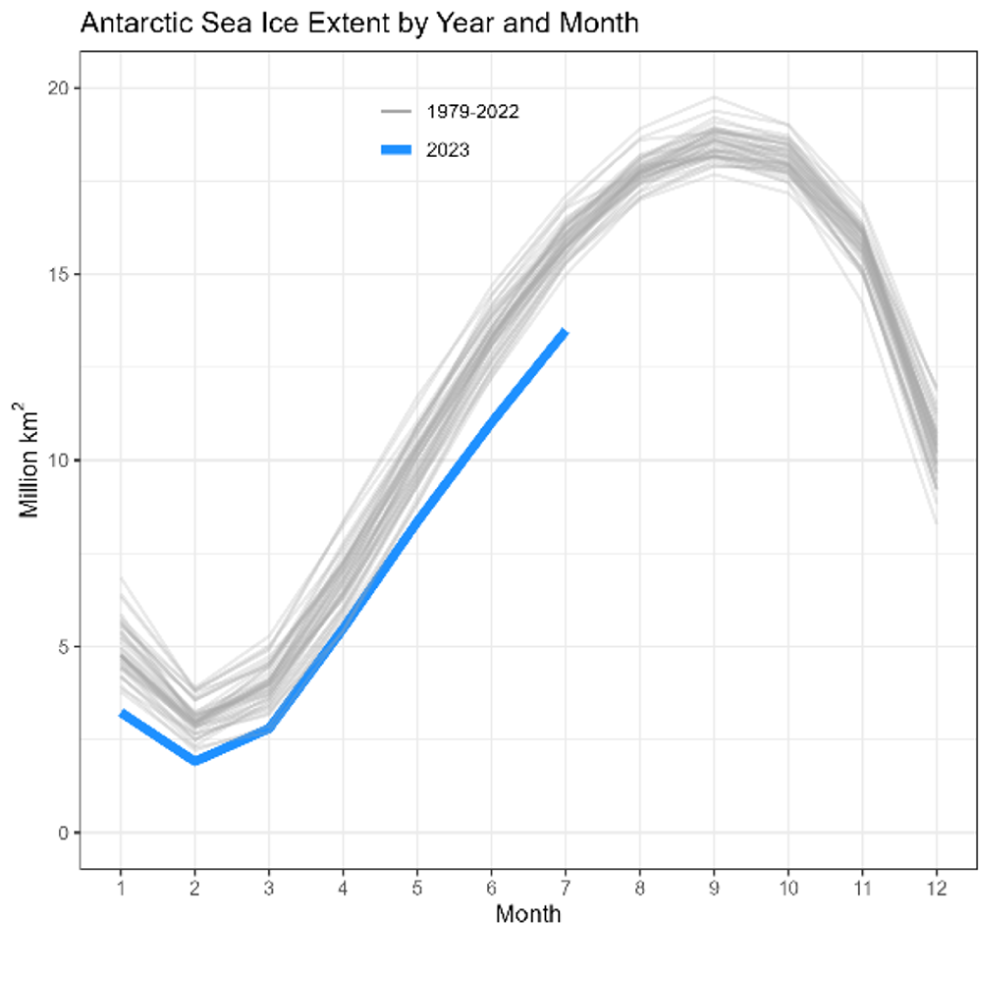
Source: National Snow and Ice Data Center
Record-Breaking Boreal Wildfire Season
The changing climate appears to be increasing the prevalence of uncontrolled wildfires. Fire analysis from Copernicus indicates that since May of this year the Northern Hemisphere has experienced widespread record-breaking fires in Canada and large fires across eastern Russia. Specifically, from January to July, accumulated carbon emissions from wildfires across Canada totaled 290 megatons, approximately equivalent to Japan’s annual carbon dioxide emissions in 2021. The emissions from the Canadian wildfires also represent more than double the previous Canadian record for wildfire-related carbon emissions over an entire year and over 25% of the global total of wildfire carbon emissions for 2023 to date.
Figure 3: Record Wildfire Carbon Emissions in Canada
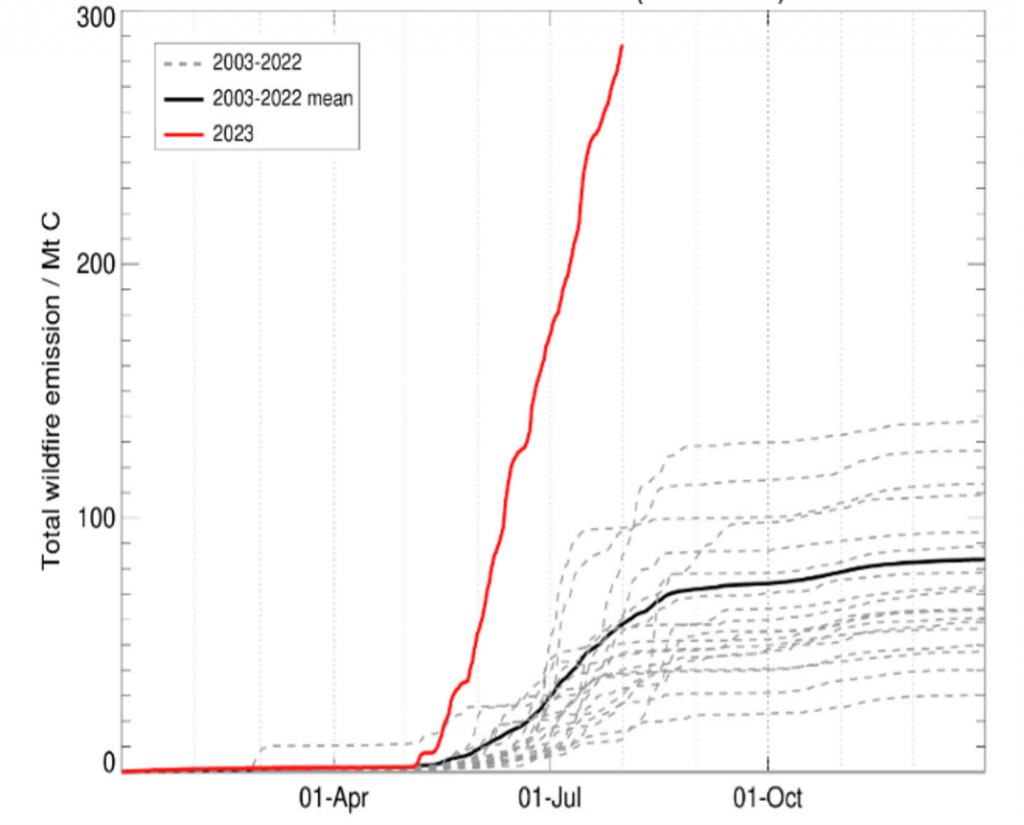
Source: EU Copernicus (CAMS) daily total cumulative estimated carbon emissions for Canada since January 1st (red line shows 2023 up to August 1st, black line shows 2003-2022 mean, and grey dashed lines show the individual years in the dataset)
According to Copernicus, warm and dry weather has created conditions conducive to the record-breaking scale of the 2023 wildfires in Canada. Climate change is making such conditions more likely and increasing the chances of longer fire seasons. Certainly, the human impact of wildfires around the world has been made starkly clear, Copernicus contends, from the tragic devastation in Lahaina to the blazes around the Mediterranean and the yellow haze in New York, along with the health dangers brought about by deteriorating air quality.
The UN’s 2023 Climate Change Synthesis Report
The above-mentioned events nearly coincide with the March 2023 publication of the U.N. IPCC’s Climate Change 2023: Synthesis Report for the Sixth Assessment Report. In this report the scientific community reiterates that humans are responsible for all global heating over the past 200 years leading to a current temperature rise of 1.1°C above pre-industrial levels, which has led to more frequent and hazardous weather events that have caused increasing destruction to people and the planet.
Nevertheless, heading into the upcoming U.N. Climate Change Conference (COP28) in December, the report also reiterates that there is still time to act to minimize the most dangerous aspects of climate change: the 1.5°C limit is still achievable, and the Climate Change Synthesis Report outlines the critical action required across sectors and by everyone at all levels.
The State of Investor Tools
For investors wishing to respond to global climate trends and the IPCC’s Climate Change Synthesis Report, several tools exist to integrate climate analytics into portfolio construction and reporting. Developments over the past few years have greatly expanded the investor toolkit. For example, investors looking to measure their exposure to physical risk due to the potential impacts of climate change will have vastly different data and analytic needs compared with the investors who are most interested in measuring their fossil fuel exposure due to a Net Zero ambition. At the same time, patterns of disclosure and regulation have forced many investors to get a head start integrating climate data into their processes.
For investors with different climate change-related concerns, ISS ESG offers climate risk and impact data tools and analytics for their individual use cases. Datasets offered fall across the domains of carbon footprint data, transition risk, physical risk, scenario alignment, and Net Zero, delivering both issuer- and portfolio-level analysis. What are some key metrics commonly used by investors in the two key areas of physical risk and carbon footprint data?
For evaluating physical risk, ISS ESG allows investors to measure exposure to some of the costliest hazards: floods, heat stress, wildfires, tropical cyclones, and droughts. As climate change is expected to increase the occurrences and intensities of physical risk hazards, investors may be concerned about the resultant financial stability of companies in future climate scenarios.
Physical Climate Risks Analysis Tool
ISS ESG’s physical climate risks analysis tool, which assesses the physical risk of over 24,000 issuers, enables investors to model hazard intensity increases, for likely and worst-case scenarios by 2050, across various hazards. Figure 4 charts the expected annual damage per physical risk hazard analyzed by ISS ESG in a future likely warming scenario. The numbers represented in the figure are grouped together by sector, illustrating different physical risk exposures within each sector. In this analysis, the Energy, Industrials, Materials, and Utilities sectors show increased exposure to physical risks, relative to other sectors.
Figure 4: Annual Impact of Physical Risk Hazards in 2050 Likely Scenario, by Sector
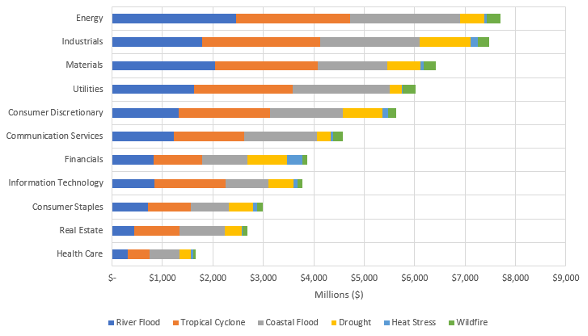
Notes: Data represents figures for FY21
Source: ISS ESG.
Carbon Footprint Data
ISS ESG can also help provide investors with rigorous carbon footprint data, including on emissions intensity and Scope 1, 2, and 3 emissions. When reviewing ISS ESG’s historical data, a transformation in the proportion of companies disclosing their greenhouse gas emissions can be observed. Figure 5 charts the progress of companies reporting their emissions, with over 24% of companies analyzed by ISS ESG in 2023 reporting their emissions, up from 19% the year prior and only 14% in fiscal year 2019. While these percentages may seem low, it is important to note that disclosure figures for constituents of indices such as the STOXX Europe 600 and the STOXX USA 500 are significantly higher. ISS ESG emissions data cover a much broader global set of equity and bond issuers across all sizes and markets, that may or may not have begun to disclose their greenhouse gas emissions.
Figure 5: Percent of Issuers in ISS ESG Universe Disclosing Scope 1+2 Greenhouse Gas Emissions
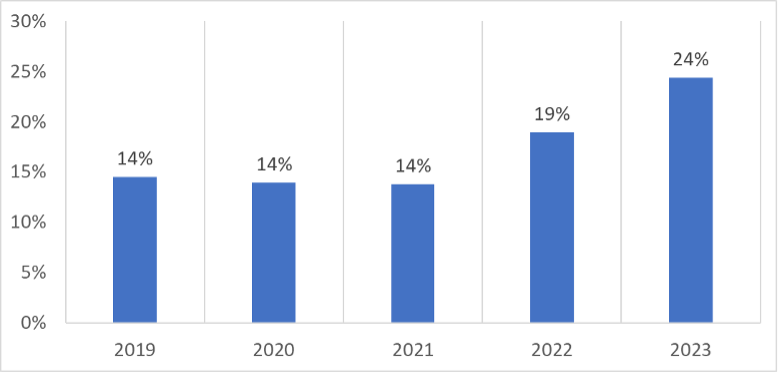
Source: ISS ESG
Simultaneously, as more companies have begun to disclose their greenhouse gas emissions, the data needs of the investor looking to analyze climate have evolved and multiplied. Currently both companies and investors are exposed to various active and potential regulatory reporting regimes and frameworks, including but not limited to the ISSB, the SEC’s climate rule, the SEC’s ESG fund-labeling proposals, and a host of more regional requirements. ISS ESG has already produced Insights commentaries on the EU’s SFDR and the UK’s Sustainable Disclosure Requirements. Just as climate science methods have expanded tremendously in recent years, investor tools and data have followed in dual advancement.
For investors looking to deepen their understanding of the impact of physical risks on their portfolio and patterns of disclosure within their carbon footprint data, ISS ESG offers a Climate Impact Report and other tools to help gauge climate change impacts on a portfolio. This comprehensive portfolio-level report automatically calculates key metrics, such as financed emissions and the weighted average carbon intensity (WACI) of a given portfolio, but also offers detailed assessments of company and portfolio exposures to transition risk, physical risk, and many other topics.
Climate Index Solutions for Institutional Investors
ISS ESG climate and energy data can also be used to construct a variety of equity and fixed income climate benchmarks, based on investor preferences. Such indices can be used to underlie Exchange-Traded Funds (ETF) or separately managed accounts. The available resources include a turnkey EU Paris-Aligned Benchmark (PAB) solution with all necessary underlying data, indices, and comprehensive climate reporting. PABs are designed to follow an annual decarbonization pathway consistent with the goals of the Paris Agreement to limit global heating to below two degrees Celsius, and as close to 1.5°C as possible. In Figure 6, the ISS ESG Climate Impact Report illustrates projected carbon emissions and scenario alignment for a PAB, compared with its parent STOXX 600 index. The data are scaled for all metrics as the percentage of the 2023 Sustainable Development Scenario (SDS) budget for the index. In this example, projected PAB index emissions (the black “Portfolio” line) fall below the SDS budget through 2050.
Figure 6: STOXX 600 PAB Projected Emissions Pathway vs. Climate Scenarios Budgets
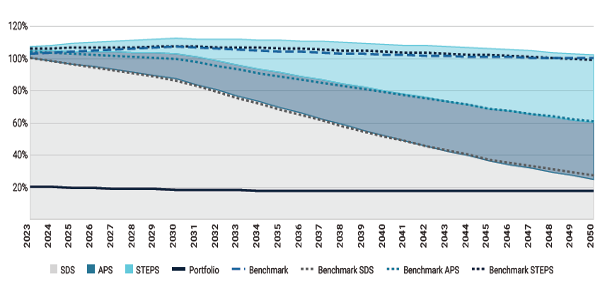
Note: The scenario alignment analysis compares current and future portfolio greenhouse gas emissions with the carbon budgets for the IEA Sustainable Development Scenario (SDS), Announced Pledges Scenario (APS), and Stated Policies Scenario (STEPS). Performance is shown as the percentage of assigned budget used by the portfolio and benchmark.
Source: ISS ESG Climate Impact Report
The Earth’s climate data is in an abnormal state, as shown empirically in this year’s record global temperatures and low sea ice extent, and as reflected by the prevalence of uncontrolled wildfires. As investors seek to integrate climate considerations into their portfolio construction and reporting, ISS ESG offers them accurate data and premier tools to navigate these concerns.
Explore ISS ESG solutions mentioned in this report:
- Use ISS ESG Climate Solutions to help you gain a better understanding of your exposure to climate-related risks and use the insights to safeguard your investment portfolios.
- ISS ESG Index Solutions develops indices and collaborates with global index providers to create innovative solutions based on high-quality, reliable, and relevant ESG data.
By: Hernando Cortina, CFA, Managing Director, ISS ESG
Sam Schrager, Vice President, ISS ESG