
In the iconic game show, “The Price is Right,” contestants are challenged on their knowledge of the prices of various retail goods. In making their guesses, however, contestants must avoid overstating prices. Overstating a price will result in an immediate loss of one’s opportunity. Contestants are therefore incentivised into guessing on the lower end of the price spectrum—a mental exercise many fund managers can likely commiserate with under the Financial Conduct Authority’s Assessment of Value (AoV) regime.
Under AoV, a fund manager can expect that if they misprice a fund on the higher end, pricing pressure will shift to front and centre as soon as performance wobbles, rendering it an almost inevitable result. Misprice on the lower end and a fund manager can expect to absorb the discount for time immemorial. AoV therefore likely creates a further impetus for fund pricing to cluster, particularly if investor demand is not price sensitive, a result the FCA seemed to be troubled by in its (Asset Management Market Study)[1].
The challenge of AoV is that it is a one-sided measure. The AoV is focused far more on supply and suppliers’ actions than on demand and the actions and motivations of investors. Lost in the discussion is the idea that if a fund is deemed poor value, then investors, either based on advice or their own judgement, will vote with their wallets. Certainly, there is no lack of funds out there to choose from—not to mention a diverse shelf of lower-cost passive options. AoV therefore seems to be avoiding the question of demand dynamics, leveraging only the element of disclosure, and the question of whether investors are actually price sensitive—a fairly crucial factor when understanding market pricing and supplier incentives. Our latest insight in fact points toward the possibility that active investors are not particularly price sensitive but are willing to pay for performance—an observation that would not lead to the conclusion that price would be the top consideration for a manager looking to improve their value narrative in the investors’ eyes. A narrative that is also supported in the AMMS itself.
Now, it is not this researcher’s prerogative to make definitive statements on the efficiency of the investment fund market, but rather to consider what insights can be gleaned from ISS MI Simfund platform’s rich fund flow data. And when it comes to demand dynamics, it can be observed within Simfund that investors best option for driving lower pricing, is likely in situations where their buying power is concentrated. It is not the size of the investor that matters, but rather the investor’s ability to pool their buying power. An observation the FCA has put forward and considered in its Investment Platforms Market Study[2].
To reach this conclusion, three factors that were anticipated to be correlated with a fund’s price were analysed: share class type, institutional vs. IA Primary type; size of the fund, comparing pricing of funds’ IA Primary share classes; and the year the fund was launched. In all cases, active and passive funds have been analysed separately, as investors’ perception of value around each type of fund may differ. This assumption was reinforced by our most recent Insight article, which left the impression that sales volumes of active funds are more performance-sensitive and those of passive funds are more cost-sensitive. This fact reverberates also in the following analysis.
Of the three factors analysed, just one made a significant difference: The size and type of buyer. Institutional share classes often offered significant discounts. The FCA’s pricing quibbles and the mythic fund size discount may therefore be more about fund buyers or their representatives failing to leverage their buying power as opposed to being a supplier issue—a hypothesis that Consumer Duty may test.
Follow the flows
In order to analyse the discounts on offer to institutional investors, understanding that institutional share classes capture a diverse group of investors, compared to retail investors, a fund’s ongoing charge figure (OCF) for its IA Primary and institutional share classes were compared. The results showed that for active funds, the median discount was 15-25 basis points (bps), with equity seeing a median discount of around 25bps.[1] For passive funds, whether equity or bond, this declined to a median of 6bps.[2] Remember though that passive pricing is already significantly lower. The data therefore highlights that there may be an opportunity for large fund buyers to drive pricing down, particularly for active funds. The size required for triggering the volume discounts differs by fund manager but is generally £1+ million. It is also worth noting that many of these fund buyers, particularly those controlling assets in the £ billions, may also have access to segregated mandates or other custom investment management arrangements to keep their costs lower. In summary, it should come as no surprise that the bigger the wallet, the greater potential to receive a discounted price—a reality that is broadly observed across the economy.
Notes:
[1]Based on a sample of 1,100 fund share classes.
[2]Based on a sample of 145 fund share classes.
Figure 1: Distribution of price differentials between active funds’ IA Primary and Institutional share classes[3]
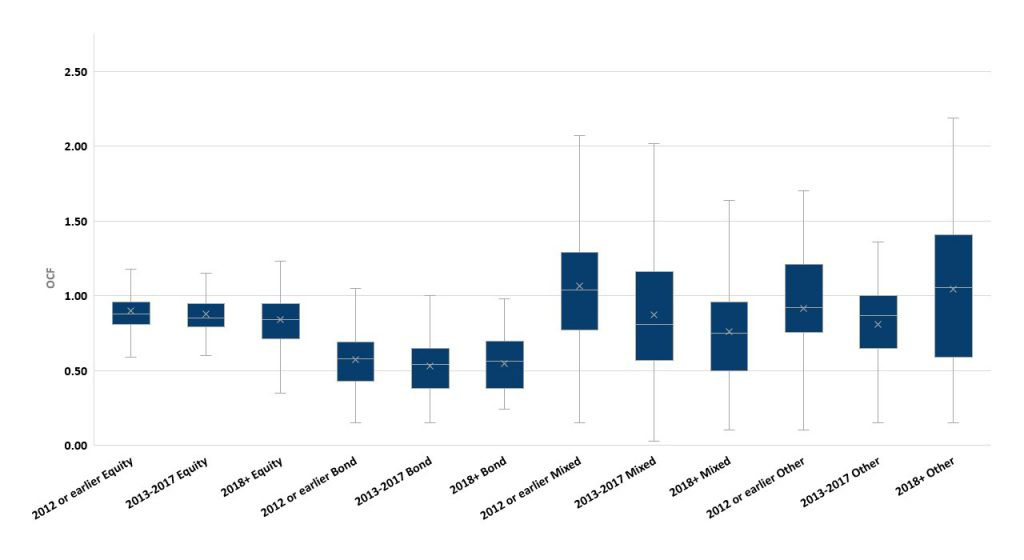
Figure 2: Distribution of price differentials between passive funds’ IA Primary and Institutional share classes[4]
Size matters … or maybe not for fund pricing
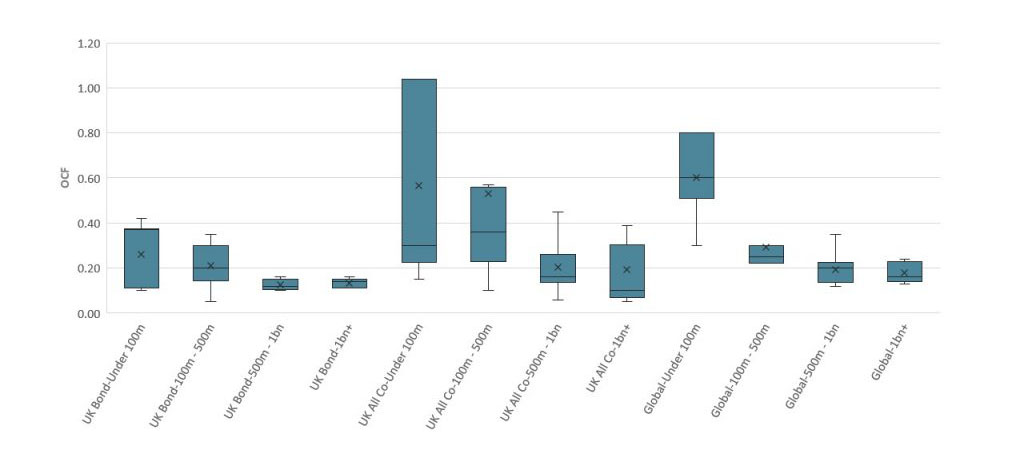
To answer the question of fund sizing, the two largest equity IA sectors by assets under management (AUM) were analysed alongside a combination of the three UK bond sectors (Corporate, Gilt and Gilt Indexed). A quick, general observation is that a fund size discount was evident only amongst passive funds. The direction of causation, however, is not clear. As passive funds inherently benefit from being relatively lower cost, all else being equal, a lower cost passive fund will perform better. The observation of larger passive funds having better pricing may therefore speak more to the fact that lower cost passive funds attract more assets opposed to being a consequence of passive funds lowering their price only after scale has been achieved.
Figure 3: Distribution of active funds IA Primary share class OCFs by total fund size for select IA sectors
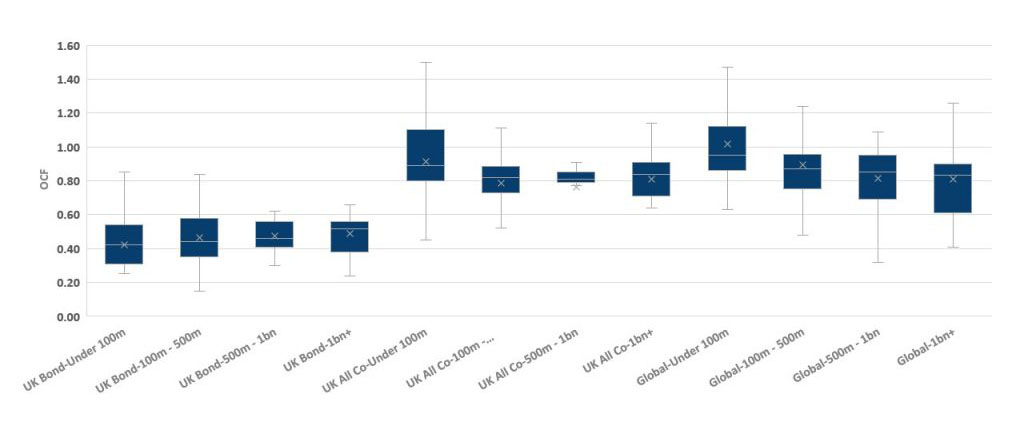
Figure 4: Distribution of passive funds IA Primary share class OCFs by total fund size for select IA sectors
For our Active dataset, there is no discernible difference between the median price of funds across fund size buckets. From a demand perspective, this does not conflict with previous observations we have made, ie. That sales inflows into active funds may be more performance- than price-sensitive. Where a difference is seen, at least in the two equity IA sectors, is that the upper end of each fund size bucket, measured by the 75th percentile, is lower for funds in the over £100 million assets under management (AUM) categories compared to funds under £100 million. This likely speaks to the fact that there is pressure for funds of almost all sizes to have a reasonable price. In fact, this language is often observed in AoV reports. A fund’s pricing is not justified based on the lowest or highest priced peer, but on its relative level, or reasonableness, compared to its peers. Funds of a minimum scale, for example £100 million, are more likely to be able to sustainably remain in this “reasonability” range. Without the evidence of significant demand drivers pushing for reductions in active fund pricing, these results do not shock.
Fund pricing has aged just fine
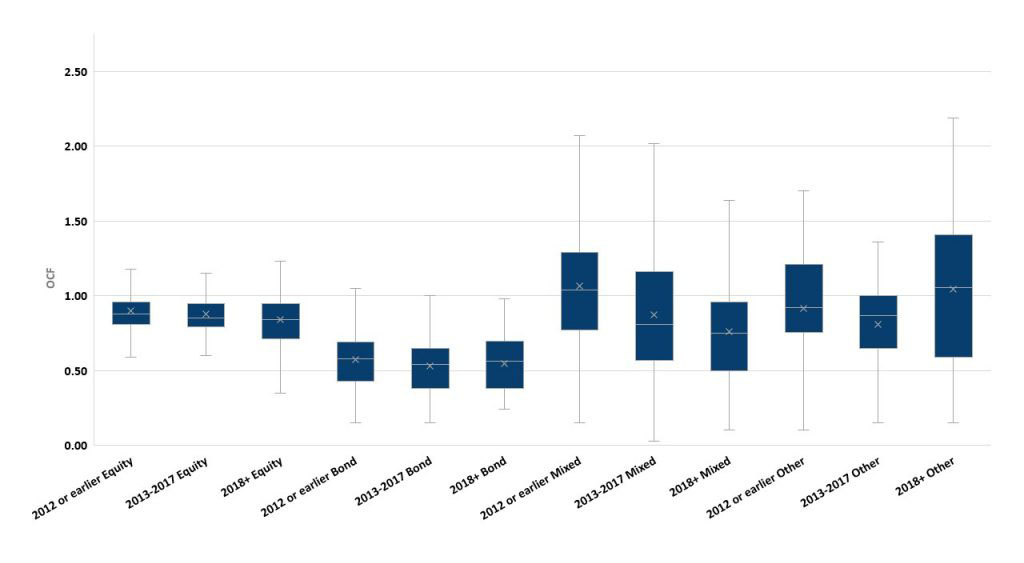
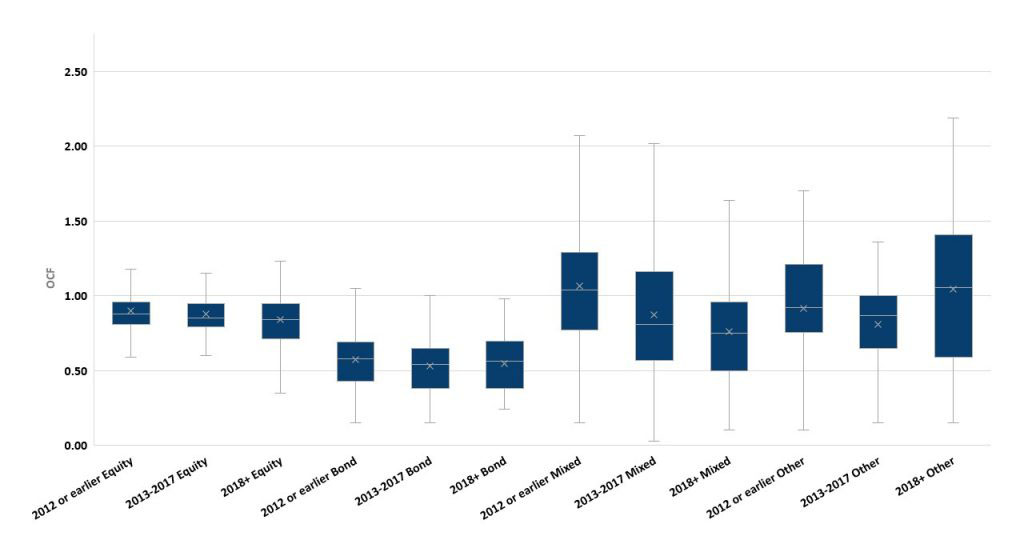
As funds are priced at the time in which they are launched, an analysis, of active funds only, was undertaken to see whether pricing significantly differs by the year that a fund was launched; the simple answer is no. With the exception of mixed funds, the median price and 2nd and 3rd quartiles do not show meaningful differences between age bands. Without a rich enough history of data here, one can surmise that this represents either a levelling off in pricing or that older funds have been kept in line on pricing over the years.
Figure 5: Distribution of active fund’s IA Primary share class OCFs by asset class and vintage
Cost will not be king—unless the kingmakers say so
Amid today’s regulatory environment there is an onus of proving one’s value, a question that, fairly or not, is generally intimately tied to cost. The cost of funds therefore will not leave the limelight any time soon—a sentiment additionally supported by the preponderance of relatively lower-fee passive competitors vying for retail and institutional investor dollars. It remains to be seen, however, what impact this pressure or illumination will have on fund pricing, and more importantly on the cost to the investor. The devil will be in the details and in recognizing that it is not in the listed price of a fund that matters, but in the price that fund buyers are able to achieve; pricing movement is therefore expected in this area. Consolidation of firms and the centralisation of investment propositions within the retail advised market could both lead to fund buyers growing in power within this segment. Assuming these consolidators leverage their power in investors’, and likely their own, interests, there is every reason to believe that fund pricing will continue to be challenged. And as this happens, expect funds to account for a lower share of investor’s total cost of investing—a fact that will bring all other value/cost centres into greater focus. Queue up Consumer Duty.
Talk to us today to learn more about how ISS Market Intelligence can help your business.
[1]To read the complete study, see: https://www.fca.org.uk/publication/market-studies/ms15-2-3.pdf
[2]To read the complete study, see: https://www.fca.org.uk/publication/market-studies/ms17-1-3.pdf
[3]IA Primary share class was compared to the lowest cost True Institutional share class available. The chart therefore highlights the maximum discount on offer. Intermediary Institutional share classes, which includes platform specific share classes are classified, show a median discount of 15bps across all share classes.
[4]For passive funds, only bond and equity funds were analysed due to a small sample size in other asset classes.
Commentary by ISS Market Intelligence
By: Benjamin Reed-Hurwitz, Vice President, EMEA Research Leader ISS Market Intelligence