The January 2023 study “ESG Performance and Enterprise Value: Do Firms with Stronger ESG Performance Have Higher Valuation Ratios?” investigated the relationship between the ISS ESG Performance Score (a normalized version of the ISS ESG Corporate Rating) and two valuation ratios from the ISS Economic Value Added (EVA) framework.
This new, complementary study also investigates this relationship and, like the January piece, applies regression analysis to a large global sample of companies observed over a recent 5-year period (June 2017-June 2022). In contrast to the first study, which examined all companies together, this second one takes a sector-by-sector approach.
Controlling for a company’s size, profitability, balance sheet strength, industry, country of domicile, and calendar quarter, this new analysis finds that the relationship between ESG performance and company valuation is either positive or null, depending on the sector considered. The most positive relationships are found in the Communication Services and Energy sectors.
In Which Sectors Does Stronger ESG Performance Translate into Greater Valuation?
To answer this question, company valuation is analyzed using the Market Value Added (MVA) Spread from the ISS EVA framework. This metric corresponds to the difference between a company’s Enterprise Value and its Capital, scaled by its Capital.
In the ISS EVA framework, Capital is defined as all assets used in business operations, net of trade funding from accounts payable and accrued expenses and after adjusting remedy accounting distortions. For instance, Capital is measured net of excess cash, net of deferred tax assets, and net of pension and retirement assets, but including leased assets, and after capitalizing and amortizing research and development (R&D) and advertising spending over time.
ESG performance is measured using the ISS ESG Performance Score, which is a normalized version of the ISS ESG Corporate Rating that considers the magnitude of an industry’s exposure to ESG risks as well as its overall footprint along the value chain. This metric ranges from 0 to 100. (More information about key variables and the sample composition can be found in the Appendix of the first study.)
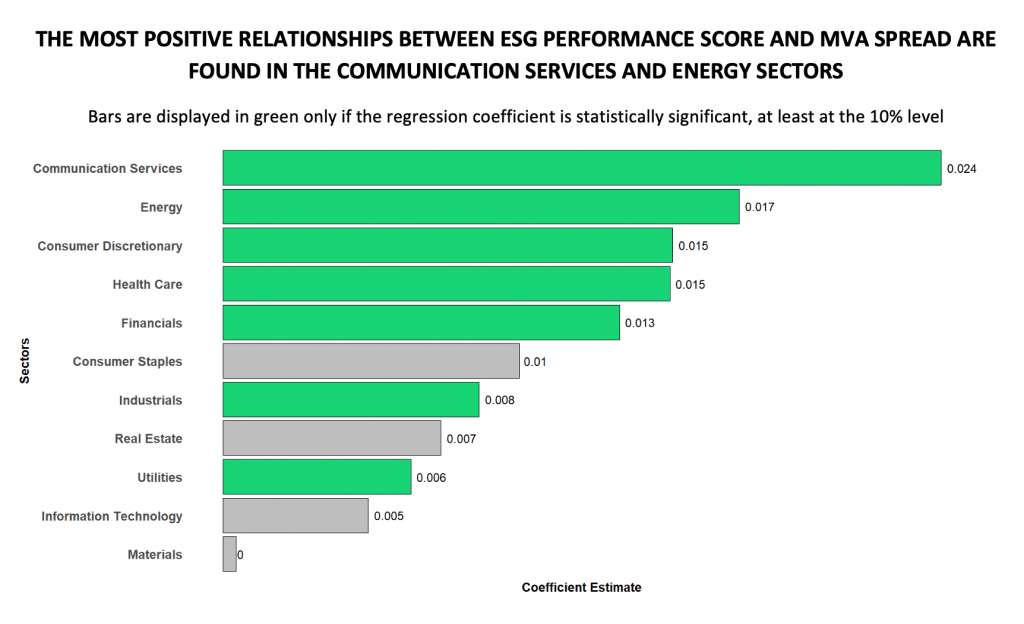
Figure 1 shows the estimated effects of ESG Performance Score on MVA Spread for different sectors. The regression models used in this study control for the effects of a company’s size, profitability, balance sheet strength, industry, country of domicile, and calendar quarter on MVA Spread.
The relationship between ESG performance and MVA Spread is positive in 7 of the 11 sectors considered. The corresponding effects are presented in green in Figure 1. In the 4 other sectors, the relationship is not statistically significant at the 10% level (i.e., the hypothesis that there is no relationship between the variables cannot be rejected).
Figure 1: Estimated Effects of ESG Performance Score on MVA Spread (Regression Coefficients) for Different Sectors
Sources: ISS ESG Corporate Rating and ISS EVA
Notes: This figure presents estimates of the regression coefficient (β) for ESG Performance Score from the following model: MVA Spreadi,t = β ESG Performance Scorei,t + γ Controlsi,t + εi,t. Statistical significance is assessed based on t-statistics using robust standard errors, double clustered at the firm and date levels.
When all companies were examined together, the regression coefficient on ESG Performance Score was positive and statistically significant. It was equal to 0.01. The relationship is stronger (i.e., the regression coefficient is larger than 0.01) in 5 of the 11 sectors considered. The relationships are strongest in the Communication Services and Energy sectors.
What Does this Mean in Terms of Enterprise Value?
While MVA Spread is a powerful tool, it is sometimes easier to think directly in terms of Enterprise Value.
MVA Spread is defined as the difference between Enterprise Value and Capital, divided by Capital. Equivalently, Enterprise Value corresponds to the product of MVA Spread and Capital, plus Capital.
In the Communication Services sector, the median MVA Spread is 0.57 and the median Capital is $5.2 billion. Plugging these figures into the Enterprise Value Equation gives an estimate of $8.2 billion (= 0.57 x $5.2 billion + $5.2 billion).
The regression model predicts that a company with an ESG Performance Score 10 points higher than a comparable one would have an MVA Spread 0.24 higher than that of its peer (=0.024 x 10). Assuming a peer with a median MVA Spread (= 0.57), the company with the higher ESG performance would have an MVA Spread of 0.81 (= 0.57 + 0.24).
Plugging the MVA Spread of this company into the Enterprise Value Equation provides an estimate of $9.4 billion (= 0.81 x $5.2 billion + $5.2 billion). This estimate is 15.0% higher than the one obtained for the company with the median MVA Spread of 0.57, suggesting that the relationship between ESG performance and Enterprise Value is not only statistically significant, but also economically meaningful. Table 1 presents the results of the same analysis for all sectors.
Table 1: Estimated Differences in Enterprise Values for Companies with 10-Point-Higher ESG Performance Scores
| Sector | Median Capital (in $bn) | Median MVA Spread | Estimated Effect of a 10-Point Difference in ESG Performance Score on MVA Spread | Estimated Effect of a 10-Point Difference in ESG Performance Score on Enterprise Value |
| Communication Services | 5.20 | 0.57 | 0.24 | 15.0% |
| Energy | 7.35 | 0.02 | 0.17 | 16.6% |
| Consumer Discretionary | 3.31 | 0.71 | 0.15 | 8.6% |
| Health Care | 1.36 | 1.78 | 0.15 | 5.3% |
| Financials | 4.27 | 0.20 | 0.13 | 10.9% |
| Consumer Staples | 3.22 | 1.05 | 0.10 | 4.7% |
| Industrials | 3.27 | 0.59 | 0.08 | 5.3% |
| Real Estate | 3.09 | 0.29 | 0.07 | 5.5% |
| Utilities | 10.41 | 0.27 | 0.06 | 4.9% |
| Information Technology | 1.84 | 2.00 | 0.05 | 1.6% |
| Materials | 4.88 | 0.35 | 0.00 | 0.3% |
Source: ISS ESG Corporate Rating and ISS EVA
Zooming in on Growth Expectations
Another important tool in the ISS EVA framework is called Future Growth Reliance (FGR). It represents the percentage of Enterprise Value that is dependent on future growth in EVA.
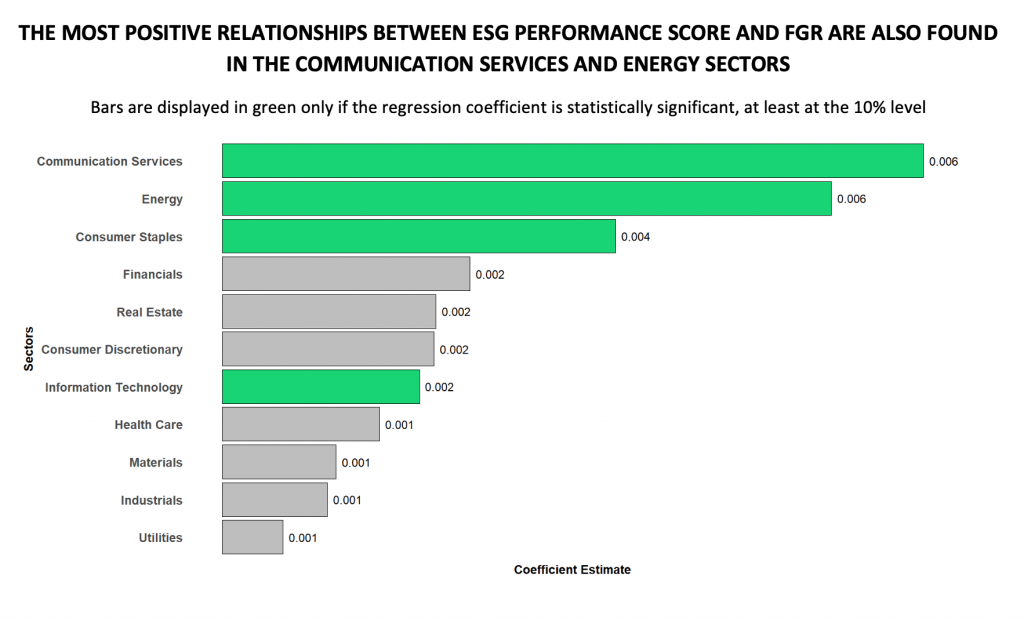
Figure 2 shows the estimated effects of ESG Performance Score on FGR for different sectors. The regression models include the same control variables as those described in the first section of this study.
Figure 2: Estimated Effects of ESG Performance Score on FGR (Regression Coefficients) for Different Sectors
Sources: ISS ESG Corporate Rating and ISS EVA.
Notes: This figure presents estimates of the regression coefficient (β) for ESG Performance Score from the following model: FGRi,t = β ESG Performance Scorei,t + γ Controlsi,t + εi,t. Statistical significance is assessed based on t-statistics using robust standard errors, double clustered at the firm and date levels.
The relationship between ESG performance and FGR is positive in 4 of the 11 sectors considered. Like in the MVA Spread analysis, the strongest relationships are observed for the Communication Services and Energy sectors. This suggests that in these sectors the higher valuations (higher MVA Spreads) achieved by high-ESG-scoring companies could be partly driven by higher investor expectations for future growth.
Limitations
This study supports the hypothesis of a positive relationship between ESG performance and Enterprise Value. However, both ESG performance and Enterprise Value can be influenced by a wide array of factors. Although several control variables were included in the regression models, there may be other confounding factors that were not considered in the analysis. Additionally, the results are specific to the 2017-2022 period and cannot be extrapolated into the future.
Conclusions
The first study in this research series suggested that a company’s ISS ESG Corporate Rating could help explain an additional level of premium or discount to contemporary EVA-centric valuation ratios. This new study shows in which sectors these relationships are the strongest.
————
ISS ESG is the responsible investment arm of Institutional Shareholder Services Inc., the world’s leading provider of environmental, social, and governance solutions for asset owners, asset managers, hedge funds, and asset servicing providers. With more than 30 years of corporate governance expertise and 25 years of providing in-depth responsible investment research and analytics, ISS ESG has a unique understanding of the requirements of institutional investors. With its comprehensive offering of solutions, ISS ESG enables investors to develop and integrate responsible investing policies and practices, engage on responsible investment issues, and monitor portfolio company practices through screening solutions. It also provides climate data, analytics, and advisory services to help financial market participants understand, measure, and act on climate-related risks across all asset classes. In addition, ISS ESG delivers corporate and country ESG research and ratings enabling its clients to identify material social and environmental risks and opportunities.
This document and all of the information contained in it is the property of Institutional Shareholder Services Inc. (“ISS”) or its subsidiaries. The Information may not be reproduced or redisseminated in whole or in part without prior written permission of ISS. ISS MAKES NO EXPRESS OR IMPLIED WARRANTIES OR REPRESENTATIONS WITH RESPECT TO THE INFORMATION.
Explore ISS ESG solutions mentioned in this report:
- Identify ESG risks and seize investment opportunities with the ISS ESG Corporate Rating.
- Understand the F in ESGF using the ISS EVA solution.
Authored by:
Arnaud Cavé, CFA, Methodology Lead – Governance, Finance, and Quantitative Research, ISS ESG
Karsten Greye, Methodology Lead – Corporate ESG-F Ratings and Controversies, ISS ESG
Roberto Lampl, Sector Head – Financials, Real Estate, Industrials, ISS ESG
Casey Lea, Global Head of Quantitative Research, ISS EVA, ISS ESG
Disha Malara, Methodology Specialist, ISS ESG