Apart from the obvious split of trading venues into the UK and Europe as a result of Brexit, another aspect of the UK departure is the equivalence recognition of Switzerland by the UK Regulator. As a result, Swiss stocks are now available for trading on UK-based MTFs. Of interest, now after a full month of the new trading venues being available, what differences have been observed.
How Have Spreads Changed?
Normally when the competition was introduced to markets through MiFID II, spreads naturally narrowed as a result of alternative venues. In the instance of the Swiss index stocks, there appears to have been no change in spreads as the overall average spread has remained consistent around 4 basis points, before and after the re-introduction of MTF trading.
Trade Volumes
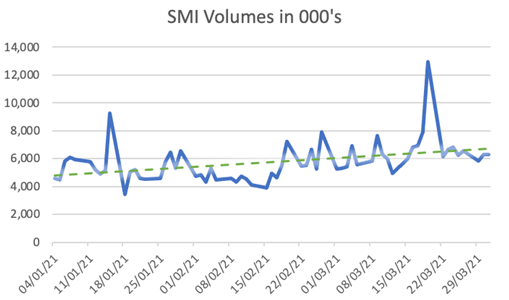
The value traded did increase sharply in mid-Feb when the MTFs were fully utilised, and we can see from the chart in Figure 1 that there is an overall increase in the daily value traded on SMI stocks on the new venues from an average of 5,322 per day, to 5,986 after the re-introduction of MTFs. These value-traded figures include SI and Off-Book, so the increase can be attributed to additional access to liquidity providers enabled by the MTF order books.
Figure 1
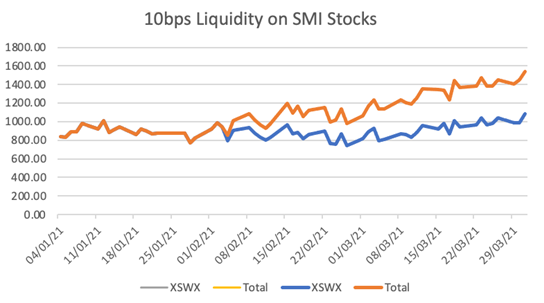
SMI Liquidity
The liquidity (based upon value available in the order books at 10 bps) profile over Q1 2021 provides an interesting perspective as presented in Figure 1, the additional liquidity provided by the MTFs can be viewed appearing in early February, but in contrast to the SIX-Swiss Exchange SMI liquidity during March which remains at a stable level, the MTF liquidity appears to be on a clear upward trajectory, thus bringing benefits to the whole market of these additional sources.
Figure 2
A further element to be explored is to what extent are the increased figures above influenced by one of the major stocks in the index versus one at the lower end of the weightings.
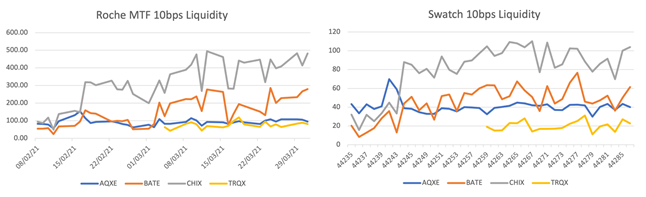
At the top end, we will use Roche (Figure 3) and can see a similar pattern to the SMI index with the dramatic increase in liquidity on CHIX soon after MTF trading re-commences, and a subsequent increase in BATE.
Figure 4 is showing Swatch, and we can observe that the pattern of increased liquidity on CHIX is common, but the increase on BATE is less pronounced.
Figure 3
Trading Venue Category
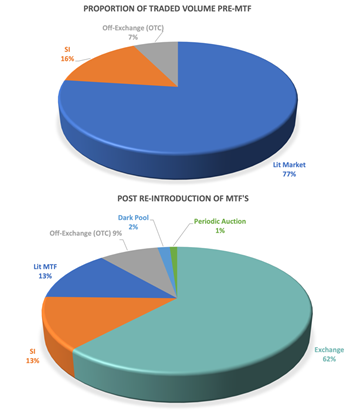
On the Venue Categories, trading was predominantly on the Swiss Exchange, but a large proportion (16%) reported on SI (Figure 4).
The proportional view in Figure 4 shows that 13% of the value is now on Lit MTFs, but the SI volumes have been relatively unaffected by the change with a slight reduction to also 13% with Dark and Periodic Auction volumes having 2% and 1% forming a more fragmented market than was seen previously.
Figure 4
Are the MTFs Competitive?
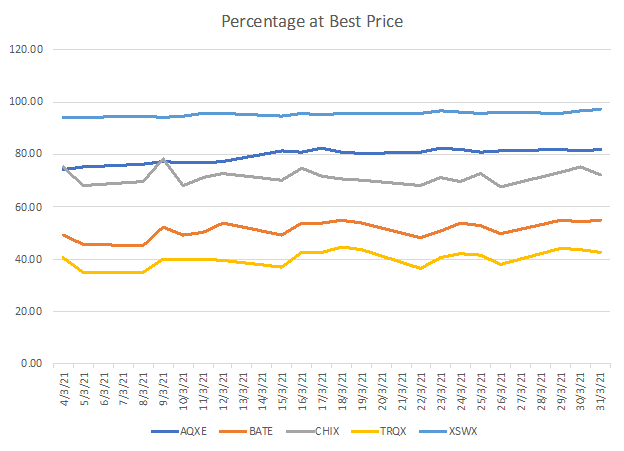
The answer to this has to be a resounding “yes”, supported by the chart in Figure 5, as although SIX-Swiss retains a significant proportion of the traded volume and presents the Best Price 95% of the time on average, MTFs such as AQXE has the Best Prices on an average 80% of the time with the advantage of the Fixed Fees for trading making them and the other MTFs an attractive proposition for any Execution.
Figure 5
For More Information Contact Mark Ford
Email: Mark.Ford@issgovernance.com
By Mark Ford, General Manager, ISS LiquidMetrix