Key Takeaways
- India is projected to have some of the highest real GDP growth in the world in 2023. Such growth will likely help support EVA Fundamentals to be stronger than the global average.
- Controlling cost-push inflation and maintaining operating leverage will be key to economic value creation.
- ISS EVA and the ISS ESG Country Rating and Corporate Rating products can support investors concerned with India’s EVA and ESG performance.
The Recovery Begins
The Indian economy reopened from COVID-19 lock downs several months ago and continues a return to a new normal. ISS EVA’s aggregate Economic Value Added (EVA) Fundamentals, a measure of economic profit and incremental economic growth, are positive for India and holding at around post-global financial crisis highs.
EVA converts accounting profit into economic profit by reversing accounting distortions and measuring the dollar value profit after all costs, including the cost of giving shareholders a fair return on invested capital, have been considered. ISS ESG uses EVA to measure financial materiality.
From a market perspective, ESG in India (which is coming from a relatively low level compared to developed markets) is continuing to show signs of improvement, as discussed in the recent ISS ESG paper, India: Trends in ESG Practices and Transparency. The average ESG Momentum (year-on-year trend change) is stable, although only six firms out of those evaluated by the ISS ESG Corporate Rating team had a positive trend. ESG Momentum can be a powerful alpha generator.
The Macro View Feeding into EVA Fundamentals
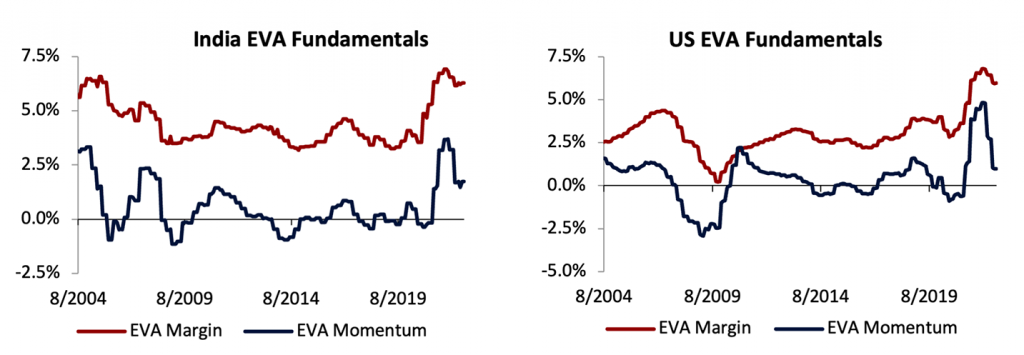
EVA Fundamentals (Margin and Momentum), although having corrected from the highs seen around the end of 2021, have recently started to show signs of improving in India. EVA Margin (a profitability measure) has so far remained resilient, which helps explain the performance of the Indian equity markets. These equity markets have been outperforming most global markets, in both INR and US$ terms, through 2022. Aggregate EVA Margin is around 6% for the 988 Indian firms under EVA coverage, which is around the same level of economic profitability as the US.
Indian EVA Momentum (incremental EVA growth) is close to 2%, which is currently double that of the US and likely to rise given that India is at a relatively early stage of reopening its economy after COVID-19 lockdowns. The interim September global OECD Economic Outlook report forecasts that India will have the highest real GDP growth in 2022, and have the second highest (after Saudi Arabia) in 2023. Translating this growth into new EVA creation would be economically beneficial for India, as (all things being equal) more EVA is always better.
Figure 1: EVA Fundamentals, India and US
Source: ISS EVA Data
EVA Drivers and a Comparison with the US
The three drivers of EVA are Sales, EBITDAR Margin, and Capital Intensity. These EVA Drivers are the three main levers that management can use to direct the future of their business. EBITDAR Margin adds back-accounting adjustments to convert EBITDA to EBITDAR, which is a ‘cleaner,’ more comparable measure of cash operating profit.
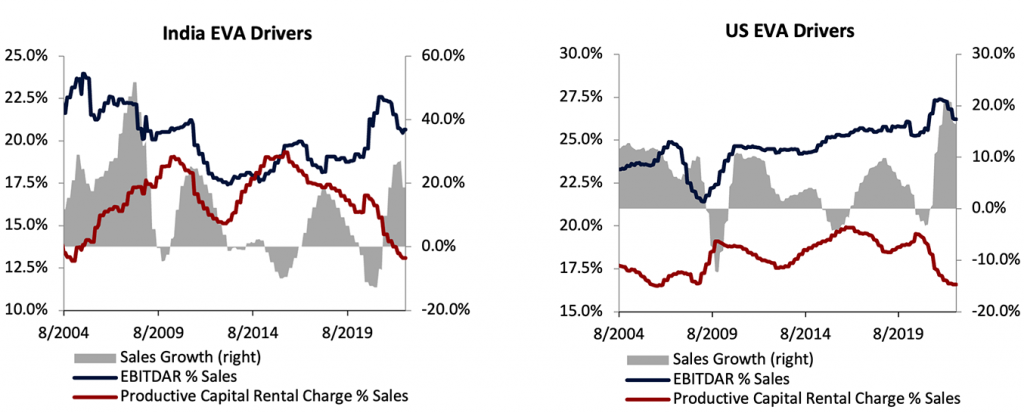
Sales growth for this current cycle peaked in May for India but remains around 19% on a trailing four quarter basis (TFQ). EBITDAR Margin in India looks to have bottomed out in June, with signs of a slight improvement over the past quarter. Cost pressures remain, mainly through adjusted Cost of Goods Sold (COGS) as a percentage of sales, which is 270 bps higher than in 2021. The Productive Capital Rental Charge (a measure of Capital Intensity), has seen continuous improvement, reaching a 17-year low (lower is more favorable) in August, supported by strong top line growth and lower investment.
Figure 2: EVA Drivers, India and US
Source: ISS EVA Data
The trends for India EVA Drivers resemble those for the US, where Sales have also slowed. Capital Intensity in the US is also around historical lows, as in India. The countries differ in EBITDAR Margin, where in the US the metric has rolled over and not yet shown signs of stabilizing.
Comparing the first few rows of the EVA Income statement between India and the US (Tables 1 and 2) shows that both have a similar level of adjusted COGS, at around 58% of sales. The large difference in cost structure is adjusted Selling, General, and Administrative (SG&A) costs, which in India are 550 bps higher than in the US. Looking at the top 100 companies by revenue size shows that India has an average adjusted SG&A of 23.3% versus 16.2% in the US. The combination of large-sized Financial and Industrial firms in India is pushing up the average costs. This is feeding directly through to a lower level of EBITDAR Margin in India than in the US. The India and US Working Capital Charges and Property, Plant, and Equipment (PP&E) Charges are similar, with both showing comparative levels of working capital and investment.
Table 1: India Aggregate EVA Income Statement

Source: ISS EVA Data
Table 2: US Aggregate EVA Income Statement

Source: ISS EVA Data
Expectations and Global Comparison
Market expectations can be measured by Future Growth Reliance (FGR), which looks at the percentage of today’s market value that is dependent on future growth in EVA. FGR rebounded back towards 2021 levels from the dip in June.
Figure 3: Expectations as Measured by Future Growth Reliance

Source: ISS EVA Data
Comparing India’s Valuation to other countries and regions shows India to be trading around one standard deviation below the 10-year mean and at an historically higher level than the global average. This valuation premium does not look historically stretched, but leaves limited room for a significant slowdown in economic value creation.
Sector Focus: EVA & ESG
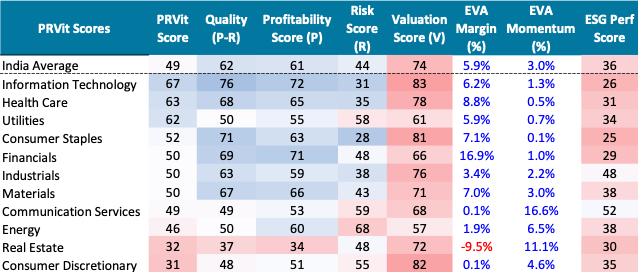
Table 3 shows the Indian sectors through the PRVit lens. PRVit is a systematic framework that translates underlying EVA Fundamentals into EVA matrices (Profitability, Risk, Value). The IT, Health Care, and Utilities sectors are the most favorably rated in the framework. Consumer Staples is preferred over Consumer Discretionary, given the much higher levels of Risk-adjusted Profitability (Quality) versus similar Valuation scores. Communication Services is the only sector to score favorably through the ISS ESG lens, with all other sectors being below ESG ‘Prime’ (< 50).
Table 3: PRVit & ESG Performance of Indian Sectors (ESG Performance, 0 = lowest; 100 = highest)
Source: ISS EVA Data, ISS ESG Data
Heat Maps
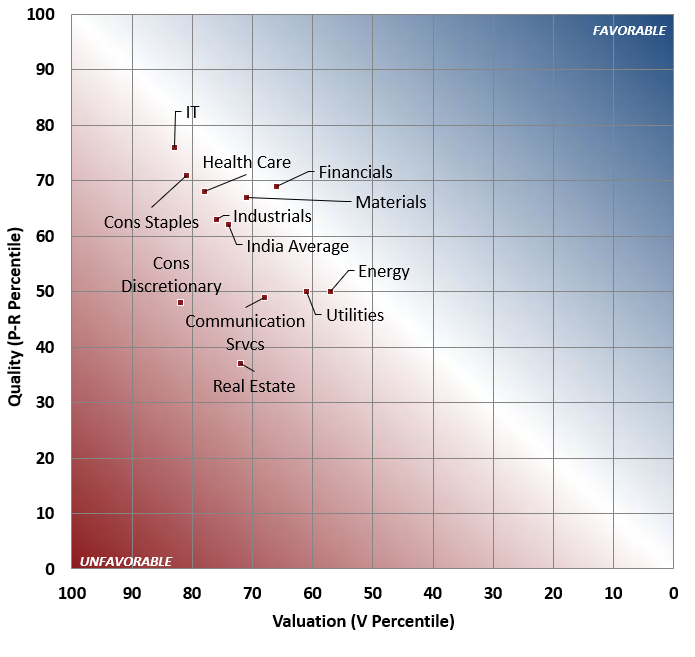
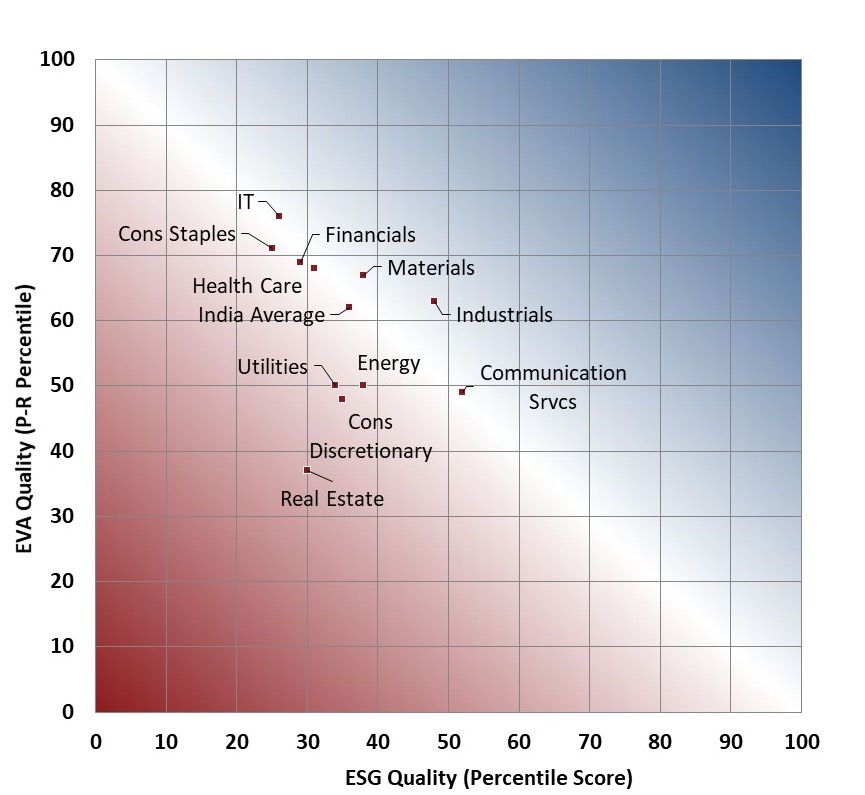
Figures 4 and 5 are sector Heat Maps. Figure 4 is the EVA traditional PRVit Heat Map, which shows the visual trade-off between Quality (Profitability-Risk) on the vertical axis and Valuation on the horizontal axis. The horizontal axis is plotted in reverse, so the most expensive stocks/industries (highest V scores) are to the left and the cheapest V scores are to the right. Sectors in the favourable (blue) area offer higher quality and/or cheaper valuation than those in the unfavourable (red) area. The Heat Map in Figure 5 replaces Valuation scores with ESG Performance Scores, with higher levels of ESG Quality being further right on the map.
Figure 4: PRVit Heat Map
Source: ISS EVA Data
Figure 5: ESG Heat Map
Source: ISS EVA Data
Conclusion
Investors are likely concerned about a possible global recession, as well as inflation and the impact of central banks hiking interest rates at an accelerated pace. India is projected by the OECD to have relatively strong economic growth this year and the next.
EVA Fundamentals have been supported through the current cycle by strong top line growth and improved asset efficiency. EBITDAR Margin contracted at the start of the year but has shown signs of positively contributing more recently. A crucial future consideration is how well costs can be controlled and how supportive sales growth can remain.
India’s ESG performance is currently stable but below a ‘Prime’ performance level. If ESG Momentum, encouraged by regulators and investors, improves in India while the country also maintains positive EVA Momentum, that could create a strong economic environment for India in 2023. Resources such as ISS EVA, ISS ESG Country Rating, and ISS ESG Corporate Rating can assist investors wishing to follow these trends.
Explore ISS ESG solutions mentioned in this report:
- Understand the F in ESGF using the ISS EVA solution.
- Identify ESG risks and seize investment opportunities with the ISS ESG Corporate Rating.
- Access to global data on country-level ESG performance is a key element both in the management of fixed income portfolios and in understanding risks for equity investors with exposure to emerging markets. Extend your ESG intelligence using the ISS ESG Country Rating and ISS ESG Country Controversy Assessments.
By: Gavin Thomson, Global Director of Fundamental Research, ISS ESG
