
Sustainability presents a potential source of enduring competitive edge, beyond risk mitigation and compliance. Research shows that firms that embed sustainable practices into their core operations tend to uncover innovation, unlock efficiencies, attract top talent, and build brand trust that fuels long-term growth.
Eccles, Ioannou, and Serafeim’s work “The Impact of Corporate Sustainability on Organizational Processes and Performance” explains that high-sustainability firms prioritize long-term value creation over short-term profits, which leads to more resilient performance. According to the research, these firms provide greater levels of non-financial data, such as environmental and social metrics, which improves investor confidence and market valuation.
Given the potential connection between operational strength and sustainable practices, companies can be classified within a framework defined by the relationship between their sustainability practices and operating profit margins. The framework consists of measuring sustainability practices and operational practices and classifying company performance within a Leaders/Laggards axis (Figure 1).
Figure 1: Leaders and Laggards on Sustainability and Operational Practices
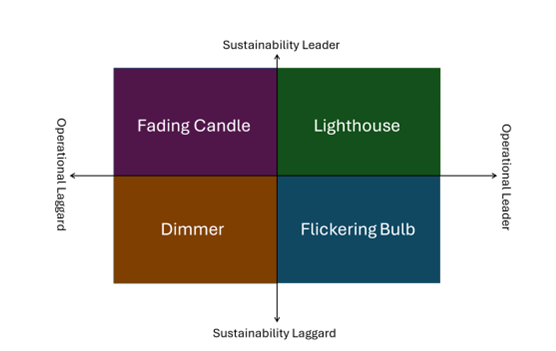
Source: ISS STOXX
The objective of the framework is to compare a company’s operational performance with its sustainable practices. Companies within the quadrants can be characterized according to how much sustainability and operational “light” they provide:
- Companies in the top-right quadrant, the Lighthouses (Sustainability Leaders/Operational Leaders) embed sustainability practices into their operational processes, complementing their already high operational standards. This aids the companies’ performance throughout the business cycle, as they are better prepared to mitigate cyclical downturns while capturing cyclical upswings.
- Companies in the bottom-right quadrant, the Flickering Bulbs (Sustainability Laggards/Operational Leaders) have sustainability practices that are below the industry standard but deliver strong operational metrics. They have this profile likely because of cyclical factors, which raises the question of the persistence of their operational strength.
- Companies in the bottom-left quadrant, the Dimmers (Sustainability Laggards/Operational Laggards) display a low strategic orientation towards sustainability endeavours and deliver below-average operational metrics.
- Companies in the top-left quadrant, the Fading Candles (Sustainability Leaders/Operational Laggards) incorporate sustainability practices into their businesses, but their operational metrics do not reflect these practices’ benefits. This could be due either to timing or to implementation challenges.
Leaders and Laggards
Companies may seek to be leaders both in operational excellence, by maximizing their operating profit margin, and in mitigating direct and indirect operational and sustainability risks over the short-, medium- and long-term. In contrast, companies that seek to lead operationally without focusing on sustainability risks, and companies that focus on sustainability risks without the ambition to excel operationally may falter one way or another and likely have a lower valuation.
Evaluating Operations
Most investment professionals evaluate a company’s operations by their profitability, with company operating margins being the first metric examined to understand how efficiently a company converts revenue into profit (see, for example, company EVA performance, which reflects operating profit margin). Companies with higher operating margins are considered by investment professionals to have competitive advantages over their peers, ranging from stronger pricing power to better cost control.
Higher operating margins contribute to companies’ resilience in cyclical downturns and make them better positioned to invest in growth opportunities, partly because higher operating margins translate into stronger and more predictable cash flows. Strong, predictable cash flows support companies’ ability to service their debt, reinvest in their business, and make dividend payments.
Because investors frequently compare operating margins of companies within the same industry, companies with consistently higher margins than their industry peers often command valuation premiums because they tend to demonstrate consistent levels of profitability.
Advantages of Sustainability Practices
Operating margins reflect the execution of the strategy determined by a company’s executive management and approved by its board of directors. This strategy signals a company’s ability to identify and mitigate operational risks. Sustainability practices may play a central role here: firms that embrace practices based on sustainability principles may gain an improved approach to risk management and opportunity creation.
For example, a firm that implements an innovative process that reduces its environmental impact can lower costs, reduce the risk of breaching certain regulatory requirements, and build an image as a pioneer within its industry. Embracing sustainability practices is exemplified by a drive for innovation, where aligning with client interests, such as greater product durability, could enable price increases. Comparing “supply chain standards and procedures” or “resource sourcing and production” are two ways an investment professional can leverage company-specific data as an input to evaluate companies within an industry-relevant sustainability framework.
Nevertheless, sustainability practices do not automatically lead to high operating margins; success in this area is complex. Aiming to be a leader in sustainability while disregarding operational excellence can lead to a higher cost profile over the medium term and disappoint stakeholders as a result. A company that lags in both sustainability and operational practices risks falling short in its competitiveness, which can lead to a decline in market share and stakeholder perception.
Integrating Sustainability into Corporate Strategy
Companies that strive to generate cashflow in a consistent manner likely attribute consistent cashflow in part to their targeting operational excellence, which involves focusing on innovation and operational risk management.
Implementing sustainable practices can foster innovation and increase a company’s chances to capture changes in market dynamics, thus ensuring the firm can continue to invest in its growth. Simply stated, pursuing sustainability can help firms focus on innovation as a source of competitive advantage.
Providing superior operational risk management benefits stakeholders from employees to customers, suppliers, management, and shareholders, because of such risk management’s focus on material issues such as health and safety, resource efficiency, and product safety. Further, operational risk management can support innovation. A company that focuses on improving the efficiency and output quality of its operations embraces a continuous improvement culture, i.e., one that understands innovation is important to stay ahead of the company’s competition.
Case Study: STOXX Europe 600
The leaders-laggards framework can be illustrated by applying it to constituents of the STOXX Europe 600:
Table 1 illustrates several fundamental factors of most of the STOXX Europe 600 constituents: the average, minimum, and maximum results for their 3-year return on capital (ROC), their EVA momentum (a positive rate of change indicating an increase in economic value added), their net-debt-to-capital ratios (a measurement of financial leverage), their 5-year EVA Margin averages, and their ESG performance scores.
Table 1: EVA Factors of STOXX Europe 600 Constituents
| Average | Minimum | Maximum | Median | |
| 3-yr ROC | 14.7% | -20.5% | 897.7% | 10.6% |
| EVA Mo 10 yrs | 0.3% | -188.6% | 127.0% | 0.2% |
| Net Debt/Cap | 17.3% | -1286.7% | 85.3% | 21.9% |
| EVA Margin 5-yr Avg | 4.0% | -45.2% | 54.8% | 2.9% |
| ESG Performance Score | 54.29 | 20.01 | 82.36 | 55.44 |
Source: ISS STOXX as of July 25, 2025
Issuer-specific data can be used to explore the profiles of companies with strong sustainability scores, exemplified by ESG performance scores of 50 or more in comparison to companies with weaker sustainability profiles, i.e., scores below 50. An ESG performance score greater than 50 depicts a company with a demonstrated ability to adequately manage material sustainability risks, mitigate negative and generate positive social and environmental impacts, and capitalize on opportunities offered by transformation towards sustainable development.
However, not all highly scoring companies from a sustainability perspective score highly across the fundamental factors, as depicted in Table 1’s dispersion of the ROC and other factors.
Nevertheless, Table 2 shows EVA factors for 49 issuers with high sustainability scores (ESG performance scores). These factors demonstrate the profiles of companies that would be classified as meeting the designation of operational excellence.
Table 2: Company EVA Factors That Demonstrate Operational Excellence
| Operational Excellence | |
| 3-yr ROC | 11.0% |
| EVA Mo 10 yrs | 2.0% |
| Net Debt/Cap | 25.0% |
| EVA Margin 5-yr Avg | 5.0% |
| ESG Performance Score | 51.60 |
Source: ISS STOXX as of July 25, 2025
These companies share the following features: an average ROC over the past 3 years of at least 11%, an EVA momentum of at least 2% over the past 10 years, a net-debt-to-capital ratio of maximum 25%, and an average EVA margin over the past 5 years of at least 5%, with an average ESG performance score of 51.60. Companies with ESG performance scores above 50 illustrate the highest level of ambition to capture industry-specific sustainability-oriented opportunities and have processes in place to aid in risk mitigation.
Companies that are, based on their fundamental profiles, operational laggards (Table 3) similarly share certain traits.
Table 3: Company EVA Factors That Demonstrate Operational Laggards
| Operational Laggards | |
| 3-yr ROC | 5.0% |
| EVA Mo 10 yrs | 0.0% |
| Net Debt/Cap | 10.0% |
| EVA Margin 5-yr Avg | 0.0% |
| ESG Performance Score | 55.08 |
Source: ISS STOXX as of July 25, 2025
They have an average 3-year ROC of maximum 5%, their EVA momentum over the past 10 years was maximum 0%, their net-debt-to-capital ratios were minimum 10%, their 5-year average EVA Margins were at most 0%, and they had average ESG performance scores of 55.08. Such an ESG performance score indicates a higher company ambition to capture industry-specific sustainability-oriented opportunities and likely also indicates lower mitigation processes to reduce the risks they are exposed to. In other words, their favorable sustainability profile is not supported by the selected financial data.
Conclusion
The purpose of the framework in this article is to help investors integrate sustainability information into their investment processes. Understanding how a company’s sustainability profile compares to that of its peers provides a valuable input into the formulation of an investment thesis.
The detailed nature of ISS STOXX materiality mapping at an industry level is one example of how investment professionals can benchmark companies. The ISS STOXX Corporate Rating solution covers over 90% of global indexes on a market cap basis and supports investment professionals in gaining a deep insight into a company’s sustainability performance.
Explore ISS STOXX solutions mentioned in this report:
- Identify ESG risks and seize investment opportunities with the ISS ESG Corporate Rating.
- Understand the F in ESGF using the ISS EVA solution.
By:
Roberto Lampl, Managing Director, Corporate Ratings Research, Global Multi Sector Head, ISS STOXX