Similar to waking up early after a long night out, fund managers and investors likely enter 2023 disoriented. Certainly, the year 2022 served up constant stream of challenges: Political uncertainty, a war and the requisite need to divest from a whole market, consumer regulatory change, greenwashing allegations, high and persistent inflation, rising interest rates, the suspension/gating of direct real estate funds, and the potential for a global recession all darkened the mood in 2022. Against this backdrop, U.K.-domiciled net flows were negative in eight of the months up to and including November 2022 (for a review of the past six months, see: Story #1).
Entering 2023, the most pertinent question for the fund management business may be this one: Can investors be persuaded to move money off the sidelines and into the markets? If so, which strategies will prove most compelling? If investors cannot be convinced, the game becomes a game of keep-away and defining a strategy to either grab hold of one’s investors or create an impetus for others’ investors to move.
Do not count on a rising tide
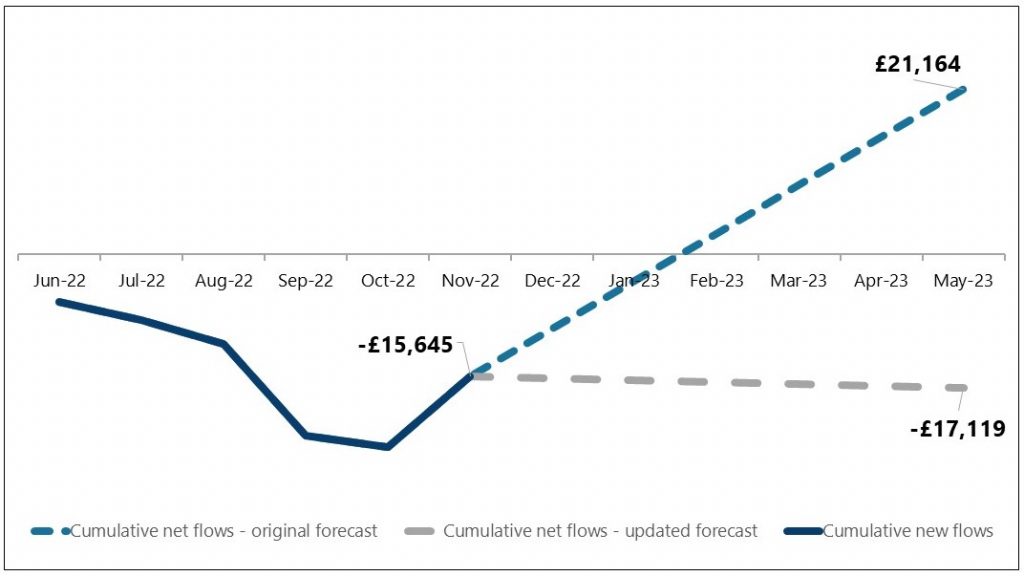
The latest forecast, generated using ISS Marketing Intelligence’s Flowspring analytical tool, strongly points towards the latter scenario, forecasting net flows to stand at -0.1% over the next six months, a significant deviation from the original 12-month forecast (see Mix of Sun and Cloud), which, if it proves correct, is predicting a sharp turnaround in flows.
Figure 1: Six-month U.K.-domiciled fund flow forecast – original vs. updated (in millions)

Source: Current data is from Simfund Global. This forecast was generated using Flowspring. Data is ex- Money Market, Alternatives and ETFs.
As opposed to making the case for the muted forecast, supported by the fact that the 2022 sentiment-killing factors mentioned above are all still in place as we enter 2023, let us look at whether economic factors support the theory of a quick bounce-back in U.K.-domiciled fund flows.
Before surveying the UK economic environment it is worth noting that some U.S. colleagues are also predicting a muted sales environment for U.S. investment fund sales. In ISS Market Intelligence’s latest forecast, U.S. investment fund sales are expected to be 0.8% in 2023, which is low by historical standards. Read our article on the five-year U.S. investment fund forecast
“It’s the household balance sheet, stupid”
Although the original quote was coined in a political context, a similar sentiment applies to fund flows. Fund flows cannot be completely divorced from the strengths or weaknesses of their investors’ balance sheets and the economic conditions they face. After all, the extent to which investors have discretionary income and whether they choose to spend, save, or pay down debt with it will have an impact on the sales potential for investment funds. In a zero-sum game which is the deployment of discretionary income, investment funds are thus but one option among many for households. With this in mind, let us look at a series of economic indicators, including household balance sheet indicators, to determine whether they support the optimistic or the pessimistic case.
One caveat of note is that the investor base for investment funds, particularly when segmented by assets, may not reflect the person on the Clapham omnibus. A majority of assets will reside in more affluent segments, which may be impacted to a greater or lesser degree by general economic trends, and whose experience and readiness to pursue a particular financial path might reflect their diverse circumstances.
Optimism

Household deposit balances: Household deposits (as measured by retail M4 deposits) have grown by £450 billion[1] since Q4 2019 and may represent the best reserve of liquid assets that fund managers can target. The open question is whether fund managers and advisers can persuade investors to enter choppy waters. Will the fear of losing purchasing power due to high inflation outweigh the fear of losing money in the markets?

Household savings ratio: The household savings ratio in Q3 2022 came in at 9%[2], a level that remains elevated from the pre-pandemic environment. The unknown factor here is whether there will be a persistently higher savings rate post-pandemic. While there is little chance that the peak savings rate of 26.8% in Q2 2020 will be repeated, it is worth considering whether some pandemic behaviours will become habits.
Neutrality

Household deposit growth: Household deposit growth returned to 2019 levels (near £50 billion) in 2022 after spiking to levels well over £100 billion in 2020 and 2021[3]. The fact deposits remain growing is a positive, as is any increase in UK investors’ household balance sheet asset base. The fact that deposit growth has slowed so considerably, however, may be another sign that competition for investors’ money will only increase.

Consumer credit growth: After falling throughout the pandemic and up until midway through 2022, consumer credit has started to grow again.[4] This represents a reversion to the pre-pandemic trend and is occurring even in the face of rising rates. Although likely to have a minimal impact on flows in the short term, it may be an indicator of a current budget squeeze for investors and will likely result in many investors having to deleverage their balance sheets down the road once there is more “free” cash flow available.
Pessimism

UK economic growth: The International Monetary Fund is predicting real GDP growth of 0.3%[5], hardly an inspiring figure. Add talk of a looming recession to the paltry prediction and it is hard to imagine investors feeling bullish about the broader economy.

Inflation: The IMF’s outlook for inflation is not much rosier, however. Inflation is predicted at 9%[6], a pace that could considerably damage investors’ budgets. Offsetting some of this effect will be rising wages, with private sector wage growth averaging 6.9%[7] between August to October. How much room rising wages create, however, is up for debate. And rising wages may soon become a moot point if the inflation-fighting measures trigger a harder—rather than an intended soft—landing for economic growth, with the associated possibility of job losses.

Pension contributions: While not likely a major contributor, one should not ignore the long-term effect of the 2012 pension reforms. With private sector coverage for occupational pension plans rising from 17.1% to 45.5% in 2021[8], more and more of investors’ retirement savings are being captured within occupational pension plans, which both lowers the budget left for saving in other vehicles and reduces the need for non-occupational pension savings.

The financial detox: both saving and deleveraging—that investors took during the pandemic does not look set to continue given the economic conditions. Investors—possibly the lucky ones at that—will likely have to trade off saving in funds, in deposits, or in other vehicles against deleveraging. Fund managers may therefore be better off heading into 2023 expecting a muted sales environment.
The big “takeaway”
However, a muted, even negative, sales environment, does not equate to a lack of opportunity. Fifty-two managers (37.4%) and 1,239 funds (43.2%) posted positive net flows year-to-date November. Opportunity was ripe in 2022 and will be again in 2023. It just might be that more energy needs to be spent on putting competitors’ assets in motion as opposed to targeting new flows into the business.
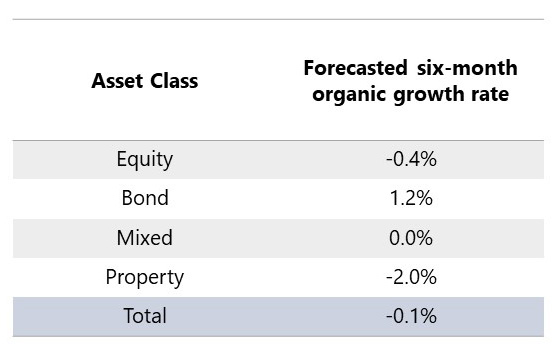
Figure 2: Six-month organic growth as percentage of beginning assets

From an asset class perspective, our forecast is not predicting any major gyrations amongst asset classes. Bonds are being given a slight advantage, with sterling bonds potentially becoming en vogue. After taking a proverbial beating in 2022, rising yields have left bonds in a more attractive position than they have been in many years. Bonds, however, could still be held back if the yield premium on bonds over deposit-based products does not outweigh risks associated with inflation and rising rates.
Mixed funds is the one area that could surprise, as this is dependent on whether new money into the business will be as muted as predicted. If new money all but dries up, mixed funds will be hit, as the shift to mixed funds is much more likely a new money story opposed to advisers shifting existing assets. Mixed fund flows look set to become the bellwether for the advice business and thus should be closely monitored.
With a muted sales environment predicted for 2023, fund managers may want to use this opportunity to rationalize and ring-fence existing assets. Those fund managers hungry for growth will be looking to put competitors’ assets in motion, turning their focus to funds that are out of date or underperforming. Time for fund managers to realise that midnight might be upon them and ask themselves: Do I know where my funds are?
Talk to us today to learn more about how ISS Market Intelligence can help your business.
Notes:
[1] Bank of England: Monthly amounts outstanding of monetary financial institutions’ sterling retail deposits (excluding notes and coin) from household sector (in sterling millions) not seasonally adjusted.
[2] Office for National Statistics: Households (S.14): Households’ saving ratio (per cent)
[3] Bank of England: Monthly amounts outstanding of monetary financial institutions’ sterling retail deposits (excluding notes and coin) from household sector (in sterling millions) not seasonally adjusted.
[4] Bank of England: Monthly amounts outstanding of total (excluding the Student Loans Company) sterling consumer credit lending to individuals (in sterling millions) seasonally adjusted
[5] International Monetary Fund: https://www.imf.org/en/Countries/GBR
[6] International Monetary Fund: https://www.imf.org/en/Countries/GBR
[7] Office for National Statistics: Monthly Wages and Salaries Survey
[8] Office for National Statistics: Annual Survey of Hours and Earnings (ASHE)
Commentary by ISS Market Intelligence
By: Benjamin Reed-Hurwitz, Vice President, EMEA Research Leader, ISS Market Intelligence


