What are the favored ways that traders are currently using to implement orders under different market conditions? Which of these are proving to be successful? Which strategies are less successful? Here we use Cluster Analysis and the LiquidMetrix Peer Universe to examine how traders are executing and the effectiveness of different types of low-touch strategies being used. Our approach is to distinguish clusters of common trading characteristics among orders and then identify the most common trading strategies used for each cluster and their trading performance.
Key Points:
- Cluster analysis allows us to group orders according to similar trading characteristics and create typical market environment profiles for analysis. We identify three typical types of orders: (a) smaller orders with somewhat negative price momentum; (b) smaller orders with neutral price momentum; and (c) larger orders with significant adverse price momentum.
- We use the LiquidMetrix Peer Universe to identify the most used strategies for each of these market profiles and measure the trade performance of different strategies used to execute for each trading environment.
- Smaller orders are still largely traded using scheduled (VWAP, TWAP) or market driven algorithms. Adverse momentum orders with larger demands for liquidity are overwhelmingly traded using Liquidity Seeking strategies. In some case, the usage of a strategy and its performance are aligned, while for other trading profiles there are significant differences.
We use orders for the period July 1, 2020 through June 30, 2021. The data is comprised of over 70 million child orders (placements) from over 100 different firms. Our approach uses Cluster Analysis[1] to identify groups (Clusters) of orders most like each other. We characterize each set of orders by their trading characteristics and examine the peer universe to determine what types of strategies are most used for each cluster, and which perform best against different benchmarks. For purposes of this analysis, we limit the data to U.S. stocks to control for local market structure and to orders with a duration of 10 minutes or greater, so that we are representing “worked” orders. The clusters are based on the following trade characteristics: Order Percent of Daily Volume, Order Size, Spread, Intra-Order Volatility, Intra-Order Price Momentum and Order Duration. The orders breakdown into three cluster classifications (see Figure 1) below.
Figure 1 – Trading Characteristic Clusters
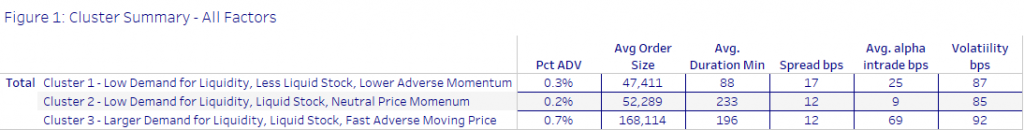
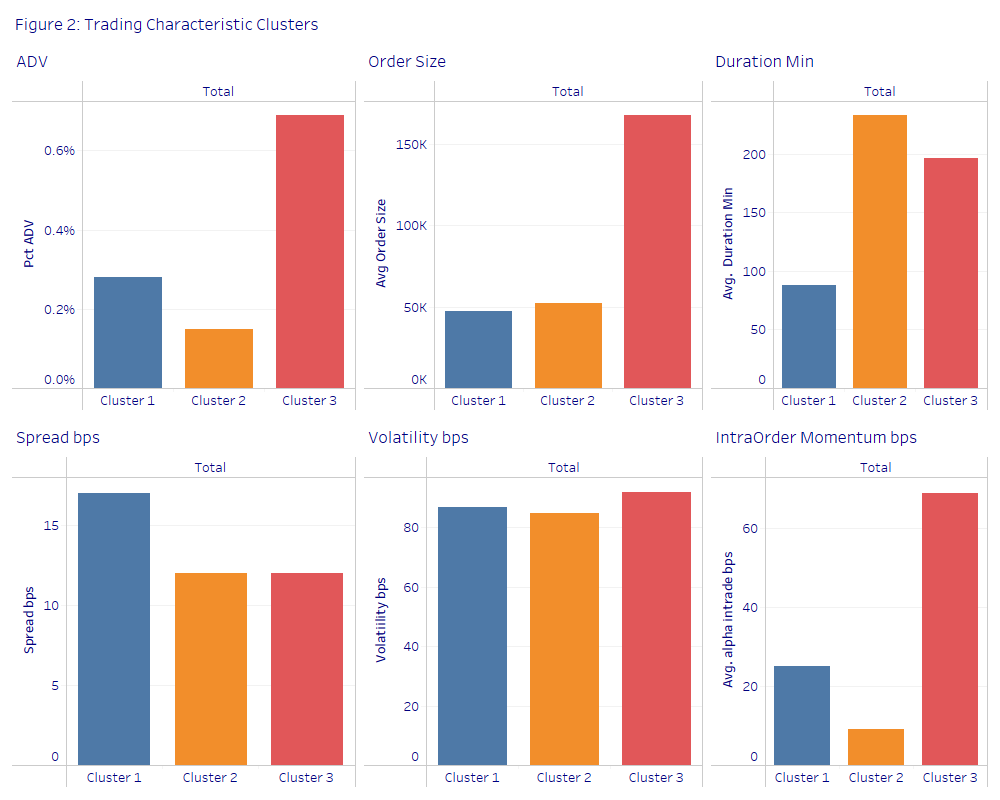
- Cluster 1 orders have less demand for liquidity but are trades in less liquid stocks than the other two clusters. Although these orders are similar in size and demand for liquidity to Cluster 2, they are traded much faster and evidence some negative momentum although not nearly as much as Cluster 3.
- Cluster 2’s orders by comparison are much smaller in size and have a much lower demand for liquidity. They also trade in more liquid stocks. Although these orders are much smaller than those in Cluster 3, they take longer to complete than those in Cluster 3 as they are traded in neutral price momentum without the urgency accompanying the negative price momentum in Cluster 3’s orders.
- Cluster 3 orders have the largest percentage of average daily volume as well as much larger order sizes. These orders have relative tight spreads indicating less risky more liquid names. They also have the largest adverse price momentum[2] and the largest intra-order price volatility.
The three types of order characteristics can be described as:
- Cluster 1: Small Orders in less liquid stocks trading with moderately negative price momentum
- Cluster 2: Small Orders in more liquid stocks without clear price directionality
- Cluster 3: Large orders with more demand for liquidity with the price moving away quickly
Figure 2 – Trading Characteristic Clusters
What types of strategies do traders use in these different sets of market conditions? We exclude orders traded high touch and leave that to a separate article and focus here on electronic strategies.
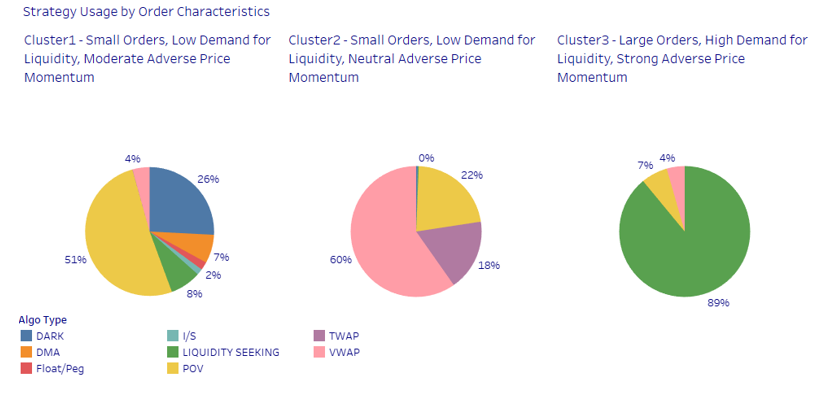
Figure 3 (below) shows that each set of trading characteristics has clear favorite “go to” strategy among traders.
For small, wider spread orders with a low ADV trading in moderate negative price momentum (Cluster 1), the preferred execution strategy is some form of participation strategy. The second choice is to place these orders into a Dark Aggregator algo. Cluster 1 has the most varied use of different strategies.
For more liquid stocks trading smaller orders where there is no strong price momentum (Cluster 2), VWAP is the dominant strategy followed by Participation and TWAP.
In the case of large orders trading in significantly adverse price momentum, the clear preference is to use a Liquidity Seeking strategy.
Figure 3 – Strategy Usage by Order Characteristics
Are these the right strategy choices for the different trading environments?
We make a distinction between measuring trading costs and measuring performance. We look at both to evaluate the fit of a trading strategy with the market characteristics profile. To measure the cost to the fund of implementing an order, we use an Arrival Price at Mid-Point Implementation Shortfall. However, implementation shortfall result is highly correlated with price momentum and timing when the order enters the market. These factors are outside the discretion of the trader and the strategy. To compensate, we use a market adjusted I/S metric to control for momentum (see Figure 4 below) and calculate the IS Cost Net of the Market Adjustment.
Figure 4 – Cluster Performance by Algo Type
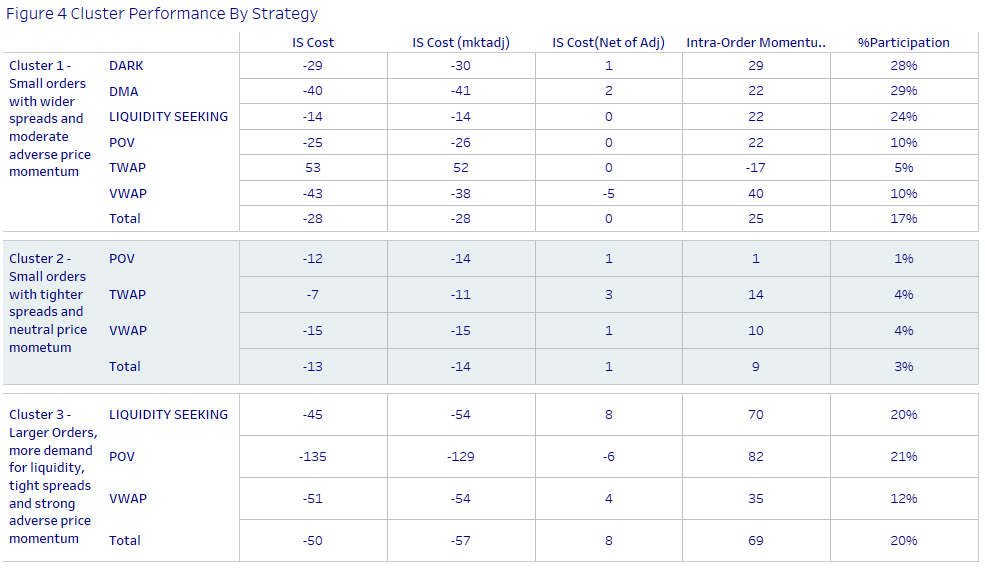
In Cluster 1, POV and Dark are the most used execution tactics. Compared to the Arrival Price, Liquidity Seeking strategies has a lower trading cost. Adjusting for price momentum, smaller orders with moderately adverse momentum has slightly better performance when using a DMA or Dark strategy.
Cluster 2 orders have low percentages of ADV, tight spreads and no clear price directions (i.e., neutral momentum). TWAP outperforms the more commonly used VWAP strategy, as well as Participation strategies.
The overwhelming consensus for Cluster 3 is to use Liquidity Seeking strategies. The intuition here is that these strategies work to minimize information leakage and complete the order before the price moves further away from the strike. The performance results confirm this view as Liquidity Seeking strategies clearly have the best performance under this type of trading conditions.
In the case of Cluster 3, the most popular strategy is aligned with the best performance. For the other two trade characteristic profiles, popularity and performance differ.
[1]The Cluster Analysis method we use here is K Means clustering where data is divided into K number of groups using centroid clustering. Every cluster has a centroid which is the mean value of all the points in that cluster. Data points are then grouped based on their distances from the centroids.
[2] We measure intra-order price momentum as the change in price from the first fill to the last fill converted into basis points.
By Henry Yegerman, ISS LiquidMetrix.