
Since 1995, US presidents have issued a series of annual proclamations designating March as Women’s History Month to celebrate the contributions women have made to the US and recognize the specific achievements women have made over the course of American history in a variety of fields. In the fifth of a series of short insights looking at the role of women in corporate America, we focus on the number of female chairs, including only those chairs who are not also the CEO, across the US’ main indexes since 2019.
Key Takeaways:
- The proportion and the number of women board chairs has grown by 68% since 2019
- The proportion of women board chairs is higher among the smallest companies.
The proportion of non-CEO female chairs among Russell 3000 companies grew between 2019 and 2021, from 4.6% to 7.8%, as the chart below shows. Numerically, the increase is from 85 to 143 women chairs. In contrast, the number of male non-CEO chairs remained somewhat steady between 2019 and 2020, and then fell in 2021 by around five percent to 1,694 male chairs.
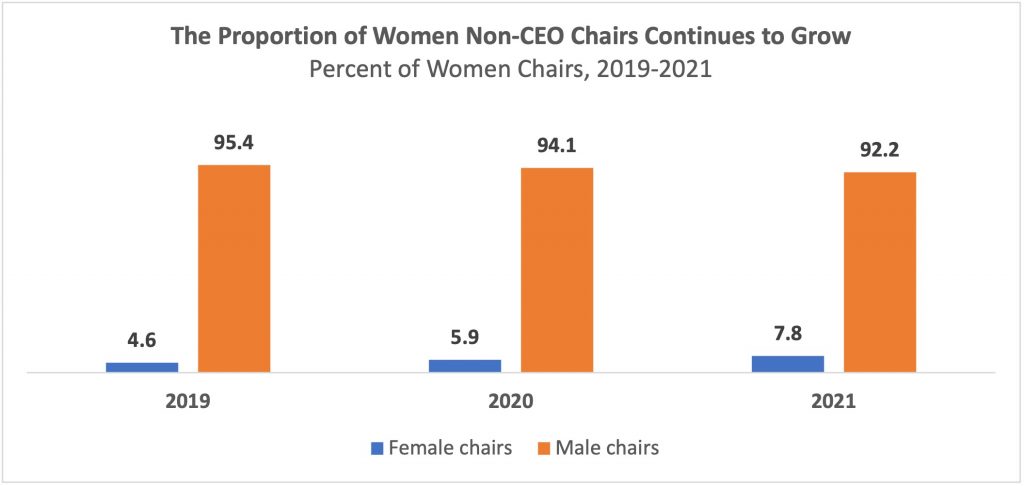
Source: ISS Corporate Solutions Data Analytics, December 31, 2021
As shown in more detail in the chart below, growth in the proportion of female non-CEO chairs has been fairly consistent across four indexes. What is striking is that the two indexes with the smallest companies have the highest proportion of female non-CEO chairs. In 2021, this stood at 8.1% and 7.1% respectively, compared to 7.7% in the S&P 400 and 7% in the S&P 500.
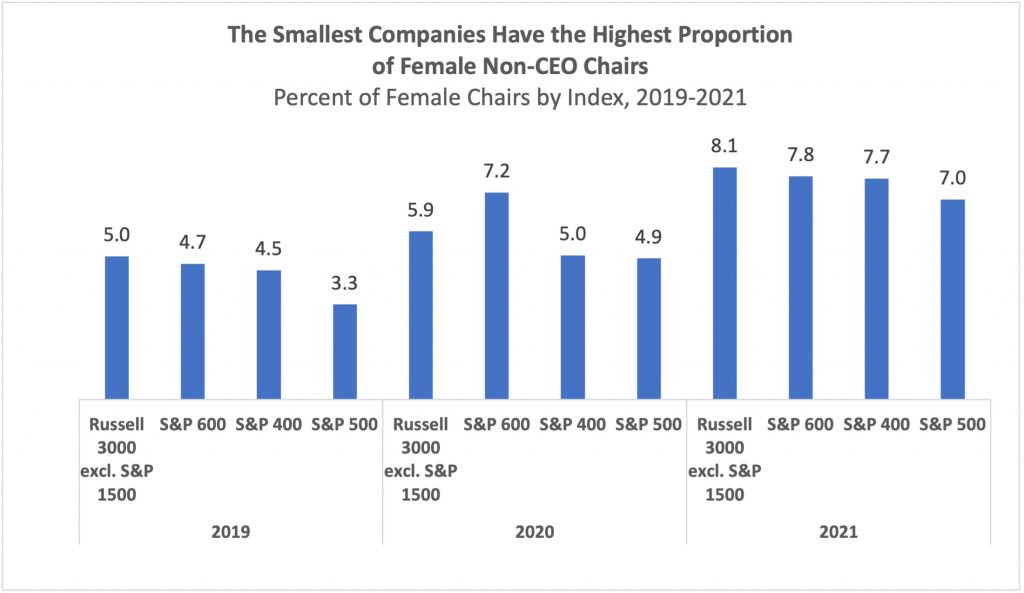
Source: ISS Corporate Solutions Data Analytics, December 31, 2021
By Paul Hodgson, Senior Editor, ISS Corporate Solutions