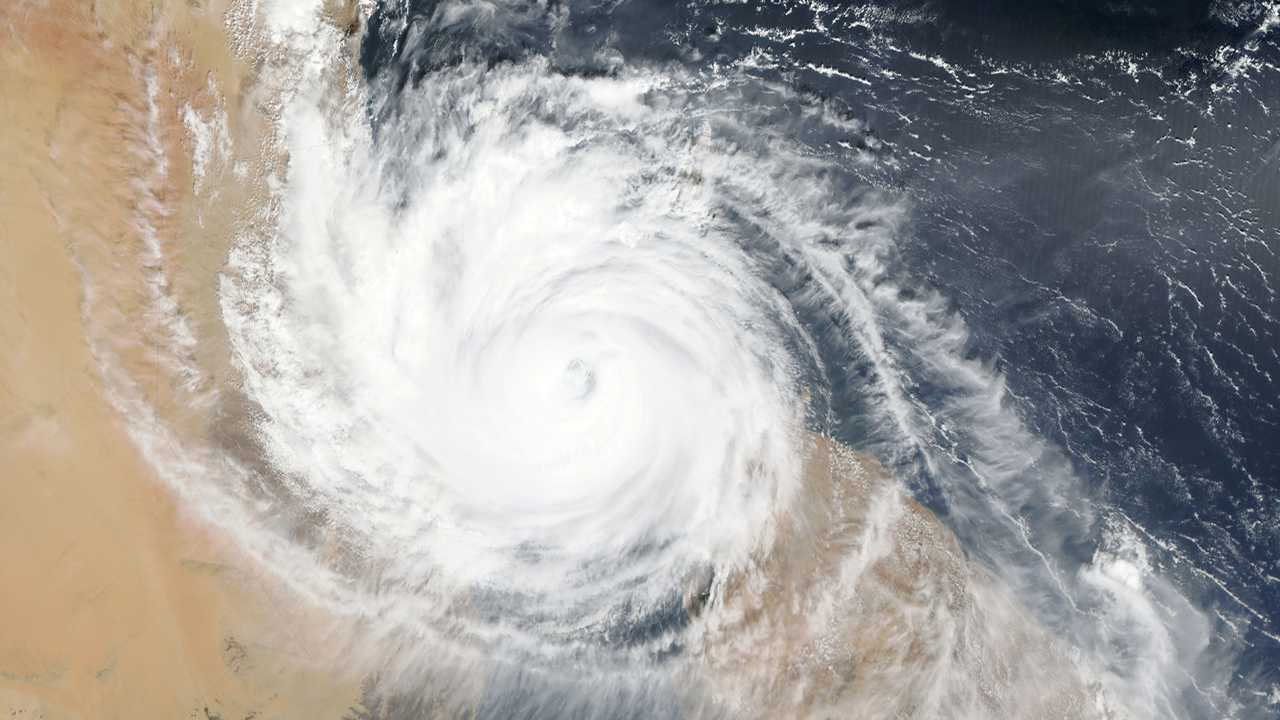
The number of billion-dollar weather and climate disasters per decade have more than quadrupled over the past 40 years. The associated costs and deaths rose from $180 billion and 2,900 dead to over $810 billion and 5,200 dead. Global warming is expected to continue disrupting the climate system and increase the likelihood of such extreme events.
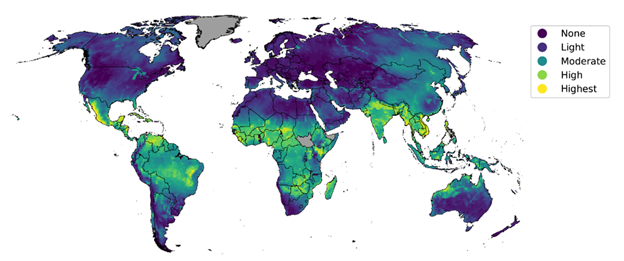
The impact of these events will not be evenly distributed across the globe (see Fig. 1 below). For example, tropical cyclones affect a small fraction of the global land area – notably the coasts of China, Japan, the U.S., and Australia. By contrast, most of the Southern Hemisphere will feel the effects of more frequent and intense heat waves projected by 2050.
Many investors ask what the financial impact of increased physical risks will be on their portfolio. This question can be addressed by conducting a forward-looking physical risks assessment.
A physical risk assessment examines the financial risks associated with weather and climate hazards in regions where a company is active – where it operates and generates revenue. For example, a company operating in coastal Japan may experience financial risk due to tropical cyclones. The company’s assets’ exposure to more frequent and intense storms can result in increased maintenance costs and business interruptions.
The ISS ESG physical risk assessment quantifies a company’s future financial risk due to five of the costliest hazards (i.e., tropical cyclones, floods, wildfires, heat stress, and droughts) for a likely and a worst-case emission scenario (Representative Concentration Pathway 4.5 and 8.5). The calculated financial risks are used to estimate the issuer’s value at risk.
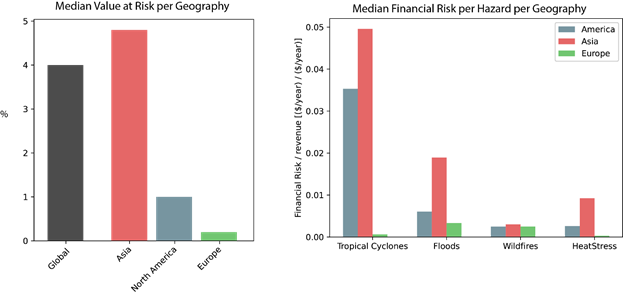
An analysis of the Solactive GBS Global Large and Midcap universe shows that the median value at risk of individual issuers is 4.0%, i.e., for $100 million invested into this universe, $4 million is at risk in a most likely scenario. As expected, the value at risk is dependent on where company assets are located. Companies in Asia are most at risk, with a median value at risk of 4.8%. Issuers with assets mainly in Europe experience minimal risk (median value at risk of 0.2%; See Fig. 2 below).
The risk gap becomes apparent when looking at individual hazards. Companies in Asia are highly exposed to the two costliest hazards, tropical cyclones and floods, and projected to be significantly impacted by heat stress (see Fig. 2 below). Companies operating in Europe have only mild exposure to floods and wildfires.
This analysis demonstrates the necessity of considering the geographical footprint of a company when conducting a physical risk assessment. Without this information, e.g., only considering country of incorporation or the geographical distribution of revenue results in an incorrect evaluation of both current and future physical risk exposure.
Find out more about ISS ESG Climate solutions and the significant enhancements to the Climate Physical Risks and Climate Scenario Analysis.
By Simon Yang, Senior Associate, Physical Climate Risk Specialist, ISS ESG