In our previous article we examined the recent growth in UK domiciled funds of funds (FoFs), concluding that FoFs represent a significant and stable growth opportunity for fund managers. These pre-assembled allocation solutions have seen, and are expected to see, consistent growth as they capture a greater share of retail investor assets. Propelling the ascent will be a trifecta of factors. The first one is demographics, and investors’ focus on retirement. The second factor is the expectation of continued market volatility, which will lead to a preference for all-weather solutions. The third influencer is the outsourcing of investment decision-making by an increasing number of advisers, who will priortise planning and the provision of other value-added services in their practices (the “advice alpha”).
The opportunity, however, is not uniform for all fund managers, as in-house investment expertise and access to distribution vary widely. In approaching the FoF opportunity, fund managers therefore need to consider where they provide the most value, be it in asset allocation, fund selection or security selection. We have noted previously that among fund managers opting for internalising all of the three components of the FoF value chain, only a few large index fund managers have experienced much success. Meanwhile, the externally managed FoF landscape demonstrates far greater diversity and is where our attention will turn next. Using ISS Market Intelligence’s Simfund fund of fund view, we will examine the opportunities available to external, or third-party managers, to capitalise on FoF growth in the UK.
Breadth of opportunity
First thing to note about the underlying fund opportunity within external FoF solutions is that the opportunity to find space on fund of funds shelves, although competitive, is broad. For the 649 externally managed FoFs with assets as of September 2022, our FoF tool captures 2,041 unique funds being used.
Eur(ope) invited
Figure 1: Underlying fund assets by domicile for UK domiciled externally managed FoFs – September 2022 (in billions)
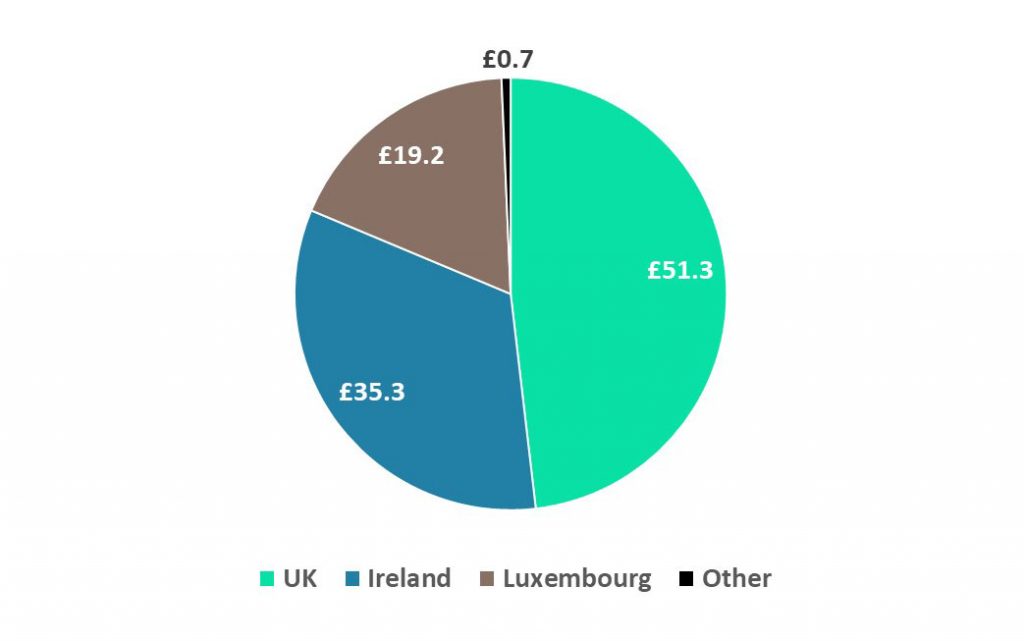
Source: Simfund (Fund of Fund View), ISS Market Intelligence. Of the £124 billion in UK domiciled externally managed funds, ISS MI’s Simfund FoF view has mapped £107 billion to underlying funds. Reasons for the discrepancy can include cash, direct security holdings and subadvisory relationships.
Competition for space on UK-domiciled externally managed FoFs shelves is an open affair, at least from a domicile perspective, with UK-domiciled funds and cross-border funds capturing a near equal share. ETFs naturally are part of the cross-border story, accounting for £14 billion of cross-border funds used. Of the £40 billion in non-ETF cross border assets, index funds accounted for nearly £7 billion and active funds for £34 billion. The takeaway here is that domicile is not a meaningful barrier to successfully being included in externally managed FoFs. FoFs in fact represent a critical route for many foreign fund managers to reach UK retail investors. The vibrant presence of non-UK funds in the FoF solutions on offer in the UK also highlights the importance of benchmarking UK-domiciled funds not just against local competition, but against the broader European market. Distribution may be local, but fund management is increasingly global. With Europe being seen as a leader on environmental, social and governance (ESG) investing, this may be a particular space to observe how this shift towards ESG-themed mandates will impact the evolution of UK-domiciled FoFs underlying fund mix.
Active participation
Assets within externally managed FoFs lean towards actively managed funds, with a £65 billion to £41 billion split between active and passive funds. This lean, however, is less than the lean seen with standalone UK-domiciled funds, where 75% of assets are actively managed. Although leaning active, the externally managed FoF category still represents an opportunity for index managers.
Figure 2: Underlying fund assets by active, passive and ESG for externally managed FoFs– September 2022 (in billions)
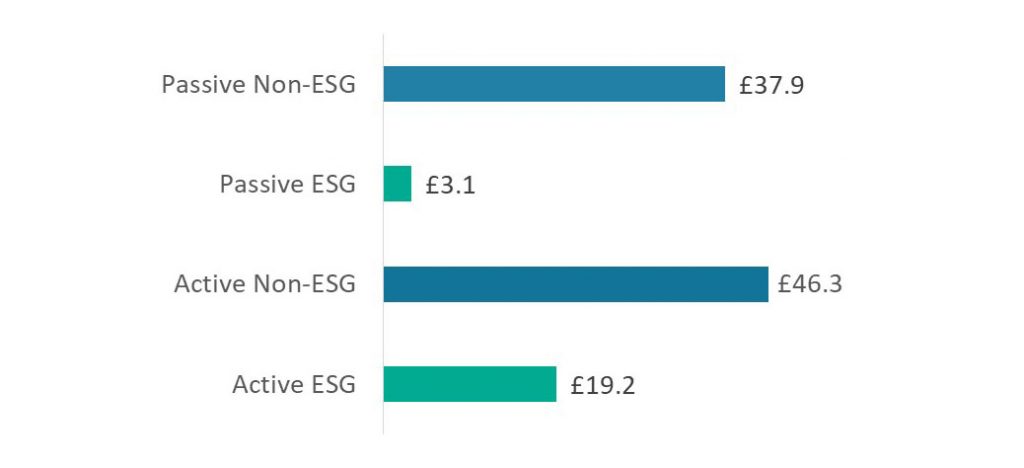
Source: Simfund (Fund-of-Fund View), ISS Market Intelligence. ESG funds are identified using the ‘Socially Conscious’ flag.
Layering on ESG to the analysis above yields the same conclusions as in our previous articles examining retail ESG trends in the UK and Europe. The majority of ESG assets are directed towards active funds. That the trend is reflected in FoFs only adds further impetus to the need to answer the “why”. And although the ESG asset bucket may seem light, with only 20% of assets, it should be kept in mind that very few FoFs are marketed as being ESG funds. If this were to change, a possibility once the Financial Conduct Authority (FCA) finalises its sustainability rules, expect external FoF managers to act quickly in identifying suitable ESG replacements for their non-ESG holdings. Given that £17 billion of the £20 billion in ESG funds are domiciled outside of the UK, European and UK fund managers will want to home in on this opportunity, although for different reasons – protecting assets (UK) versus acquiring assets (Europe).
Assets weighted towards traditional classes
With FoF assets more weighted towards proportionally higher equity asset allocation solutions, equity funds have captured the greatest share of underlying fund assets, representing 58% of all fund assets held. Of the equity assets held, 57% is active versus 43% passive. Bond funds, meanwhile, represented 28% of assets with a slightly higher lean towards active funds, at 61%. As long as retail investors in aggregate are prioritising growth in relation to retirement objectives, this split is not anticipated to change dramatically–unless, of course, there is an alternative way to generate the desired returns!
Figure 3: Underlying fund assets by Fund Category for externally managed FoFs– September 2022
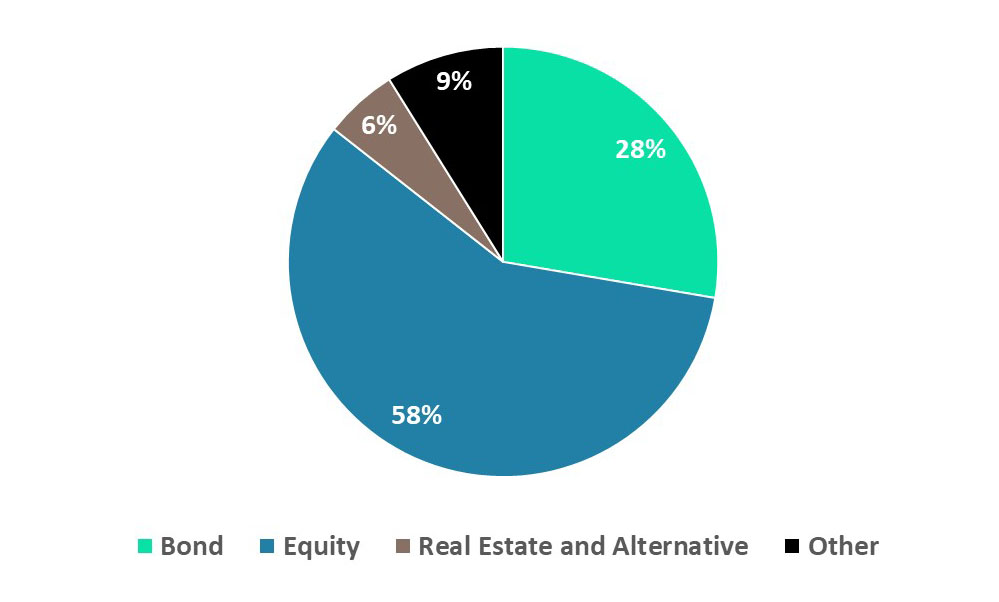
Source: Simfund (Fund-of-Fund View), ISS MI
Liquid alternatives and real estate funds currently only account for 5% of underlying assets but may be worth watching. With increased volatility and pressures on traditional asset class returns, return diversifiers will likely have additional appeal in the coming years. Growth in alternatives, however, could be restricted without parallel growth in the number of large alternatives funds that can be invested in.
Where’s your opportunity and at what price point?
Competing for FoF assets, and more generally, asset allocation assets, will be about differentiation. What can you as a fund manager, traditional or not, deliver of value? In building FoFs, achieving a competitive price requires asset allocation/fund selection costs to be balanced against security selection (underlying fund) costs. For in-house FoFs balancing the equation is theoretically simpler as the split between asset allocator and security selector is less important. However, the question left begging is “what value do retail investors and advisers assign to independence”? How steep is the discount for keeping it all in-house?
Unbundled asset allocation solutions, such as model portfolio services (MPS) and robo-advisers, have added transparency to the cost of asset allocation/fund selection and security selection. In this fashion, these disruptors are shining the light on—and enabling the scrutiny of—each element of the value chain of the asset allocation solution. Fund managers need to be ever more attuned to what drives the cost and value of their asset allocation solutions.
Thus, identifying and capturing the FoF opportunity requires an understanding of the asset allocation solutions market and of one’s strengths. Winning opportunities exist both at the FoF level and at the underlying fund level. Each participant must ask themselves whether one is best placed to be the distributor, the builder, the security selector or all three. Answering this question will require data which can be found in ISS MI’s Simfund FoF view.
Talk to us today to learn more about our Simfund fund of fund view
Commentary by ISS Market Intelligence
By: Benjamin Reed-Hurwitz, Vice President, EMEA Research Leader, ISS Market Intelligence

